IODP
Expedition 318: Wilkes Land Glacial History |
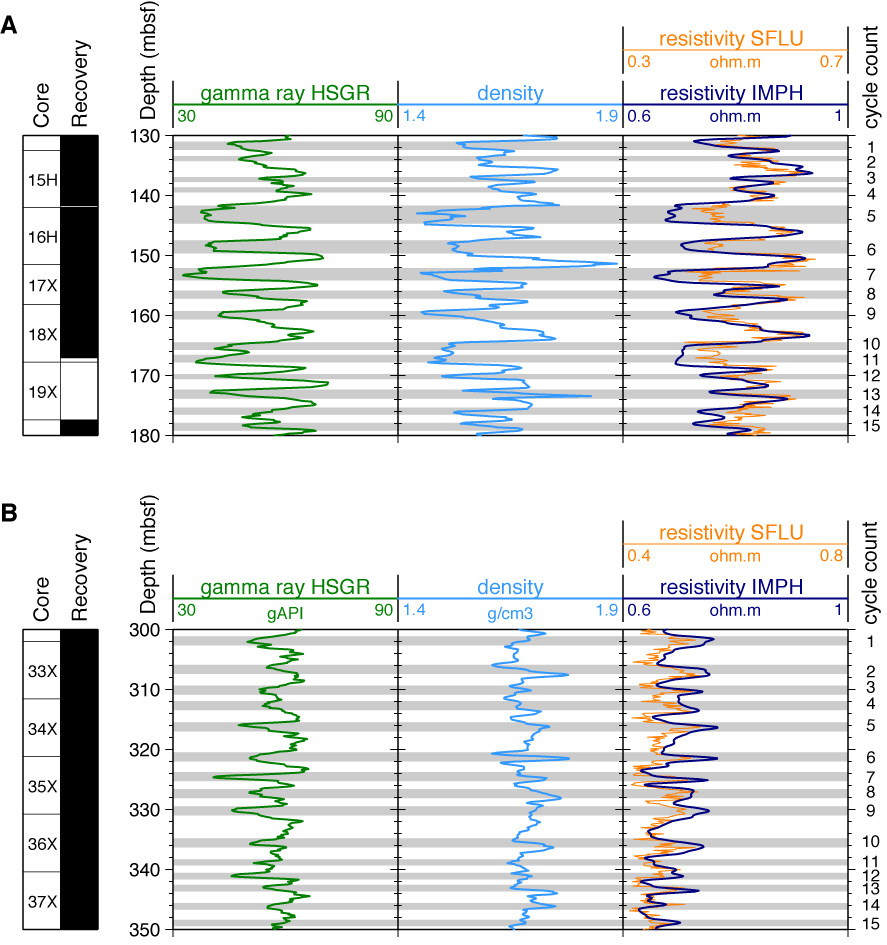
Figure
3 |
Comparison of downhole logs near the top (A, 130-180 mbsf, ~5.5-7.5 Ma) and bottom (B, 300-350 mbsf, ~10.5-11.5 Ma) of the logged interval at U1361A, showing correlation between gamma radiation and resistivity logs in A. and anti-correlation in B. Grey bars mark low natural gamma values, thought to be caused by microfossil-rich sediment layers. A consecutive count of these layers is given on the right of the image, giving an estimate for the average duration of the alternations in the 60-150 kyr range. |