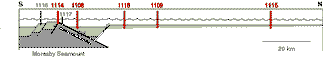
Figure 1: map of Leg 180 sites
Figure 2: Schematic cross section of Leg 180 sites. Logged sites are highlighted
Logging significantly contributed to the analysis of the sedimentary fill of the hanging wall of the Woodlark Basin by:
Formation MicroScanner (FMS) images helped detail and orient the sedimentary sequences and the fractured dolerite basement. The FMS caliper data also revealed generally north-south borehole elongations.
Leg 180 was designed to investigate a seismically active low angle normal fault in the Woodlark Basin. The three main objectives were:
A related objective was to constrain the time to depth conversion of the available multichannel seismic data by tying it to borehole data.
The logging plan was designed to contribute to these objectives by:
Five holes were logged during leg 180: 1108B, 1109D, 1114A, 1115C and 1118A (Fig. 1 and 2, Table 1).
Gamma ray, porosity, and photoelectric effect data were used onboard to define logging units that correlate with or complete the lithostratigraphic units derived from core analysis. The higher resolution FMS images helped identify and orient structures.
|
|
|
|
Figure 1: map of Leg 180 sites |
Figure 2: Schematic cross section of Leg 180 sites. Logged sites are highlighted |
|
HOLE |
LOGGING OPERATIONS |
LOGGED INTERVAL |
COMMENTS |
||||
|
|
water depth (mbrf) |
run |
pass |
Tool String |
Bottom |
Top |
|
|
1108B |
3188.3 |
1 |
up1 |
Triple combo |
165 |
73 |
APS minitron not activated |
|
1108B |
3188.3 |
1 |
up2 |
Triple combo |
163 |
72 |
Logging speed too high for high resolution data |
|
1108B |
3188.3 |
1 |
up3 |
Triple combo |
163 |
-68 |
Formation activated by previous pass |
|
1109B |
2222.2 |
1 |
down |
Triple combo |
786 |
102 |
|
|
1109B |
2222.2 |
1 |
up |
Triple combo |
786 |
-68 |
|
|
1109B |
2222.2 |
1 |
repeat |
Triple combo |
141 |
24 |
|
|
1109B |
2222.2 |
2 |
up |
FMS-sonic |
351 |
82 |
Tool stopped downward by restriction |
|
1109B |
2222.2 |
3 |
up |
FMS-sonic |
786 |
376 |
Pipe lowered to log below the restriction |
|
1114A |
418.0 |
1 |
up |
Triple combo |
305 |
-27 |
|
|
1114A |
418.0 |
2 |
up1 |
FMS-sonic |
298 |
96 |
|
|
1114A |
418.0 |
2 |
up2 |
FMS-sonic |
299 |
39 |
|
|
1115C |
1160.3 |
1 |
up |
Triple combo |
784 |
-38 |
|
|
1115C |
1160.3 |
2 |
up1 |
FMS-sonic |
787 |
726 |
Aborted pass to resynchronise the heave compensator |
|
1115C |
1160.3 |
2 |
up2 |
FMS-sonic |
784 |
152 |
|
|
1115C |
1160.3 |
2 |
up3 |
FMS-sonic |
787 |
42 |
|
|
1118A |
2315.4 |
1 |
up |
Triple combo |
891 |
-67 |
|
|
1118A |
2315.4 |
2 |
up1 |
FMS-sonic |
892 |
800 |
Repeat section in the basal conglomerate |
|
1118A |
2315.4 |
2 |
up2 |
FMS-sonic |
891 |
67 |
|
|
The logged intervals correspond to the first and last data in the file. |
|||||||
|
Actual measurement interval vary according to sensor position in the tool string. |
|||||||
Table 1: Logged intervals
Fault zone Site 1108 (pilot Hole 1108B) was logged with only the triple-combo tool to 160 mbsf. The radioactive source was not used due to safety concerns over unstable hole conditions, which ultimately led to abandonment of further logging operations (Table 1). Because of the presence of hydrocarbons, the plan for a deeper reentry hole to the fault zone was abandoned.
The hanging wall sedimentary sequence was sampled to 800-900 mbsf at Sites 1115, 1109, and 1118. Each site was logged with triple combo, FMS and the Well Seismic Tool (WST) that acquired vertical seismic profiles (Table 1).
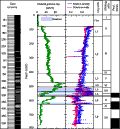
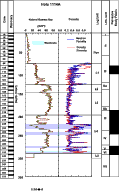
Hole 1115C reached the Miocene forearc pre-rift sequence (units L8 and L9) (Fig. 3). The conglomerate (unit L7) that overlies this sequence is marked by a sharp drop in gamma ray and porosity and a sharp rise in sonic velocity (Fig. 6). Large borehole washouts degrade the porosity measurements of units L6 and L5. Higher up, the deep marine environment of unit L2 and L1 corresponds to lower gamma ray and higher porosities. The divergence of the two porosity estimates in unit L1 indicate a high clay content.
Figure 3: Hole 1115C synthetic results.
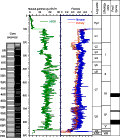
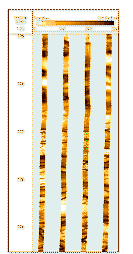
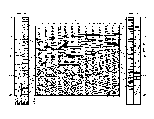
Holes 1109D and 1118A bottomed in a dolerite basement (unit L11, Fig. 4 and L10, Fig. 5) overlain by a non marine conglomerate (unit L10 and L9 respectively). These two units are marked by very low gamma ray. At Hole 1109D, the FMS images show that the dolerite is fractured (Fig. 6).
|
|
|
|
|
Figure 4: Hole 1109D synthetic results |
Figure 5: Hole 1118A synthetic results |
Figure 6: FMS image of the dolerite basement at Hole 1109D |
In Hole 1109D the brackish environment of unit L9 correspond to high gamma ray and to high uranium content (Fig. 4). Units L8 and L7 show a convergence of the two porosity estimates that indicate a low clay content, and high sonic velocity (Fig. 7). Unit L8 (Fig. 4) has a high carbonate content, low gamma ray and higher sonic velocity (Fig. 7); this correlation of sonic velocity with carbonate content was often observed at different scales at most sites. Unit L7 is more sandy and corresponds to high gamma ray. This unusual pattern of high gamma ray associated with clean sandy layers is observed repeatedly on a finer scale in the syn- and post-rift sequence of all logged sites. The divergence of the two porosity estimates in most upper units indicates a significant clay content above unit L7. This divergence is extreme in unit L5 where we infer that clay swelling caused the obstruction that required to lower the pipe to log the bottom part of the hole with the FMS (Fig. 4).
Figure 7: Sonic velocity in Holes 1114A, 1118A, 1109D, and 1115C
Unit L2 in Hole 1109D illustrates the value of the continuity of the log record (Fig. 4). This unit was poorly recovered and only one anomalously high sonic velocity measurement was available before logging. The sonic log, however, confirms the existence of a clean, dense radioactive sandy carbonate unit with a high sonic velocity that corresponds to a regional seismic reflector (Fig. 7).
The combined log response (Fig. 4, 5 and 7) suggests that unit L2 in Hole 1109D correlates with unit L2 in Hole 1118A. However this unit is thicker, displays a weaker velocity contrast and a higher clay content in Hole 1118A than in Hole 1109D, which suggest a lateral facies variation.
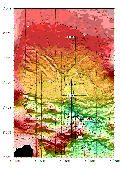
Density and sonic velocity derived from logs (Fig. 7) and measurements on cores as well as vertical seismic profile data allowed us to tie the sites to the regional multichannel seismic reflection data (Fig. 8). These ties confirm the correlation of unit L2 between Holes 1109D and 1118A.
Figure 8: Seismic integration of Holes 11109D and 1118A
The logging response helped differentiate lithostratigraphic Unit I into log Unit L2, L3 and L4 in Hole 1118A. The similar response of Units L3 in Holes 1109D and 1118A suggest a correlation between these two units: in both cases clay content is high, as inferred from the porosity divergence, thin clean beds are rarer than neighboring units, and gamma ray is low. This later coincidence reinforce the observation that higher gamma ray is mainly associated with cleaner sandy beds.
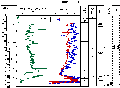
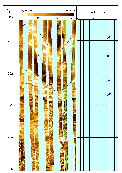
1114A reached a dolerite basement (unit L5, Fig. 9) that is separated from the overlying sequence by a tectonic breccia imaged by the FMS (Fig.10). The log data in unit L4 were affected by washouts.
|
|
|
|
Figure 9: Hole 1114A synthetic results |
Figure 10: FMS image of the dolerite basement at Hole 1114A |
The upper part of Holes 1109D, 1118A and 1115C show evidence of hydraulic erosion attributed to core retrieval. However this erosion is more pronounced in the N-S direction, which suggest a link with the N-S expected regional minimal principal stress direction. Deeper N-S elongations with breakout characteristics are also present in Hole 1115C and 1118A.
Logging Summary prepared by:
Bernard Célérier, Jacqueline Floyd, Elisabeth Screaton, Robert Laronga, Andrew Goodliffe, Véronique Louvel
Proceedings of the Ocean Drilling Program, Initial Reports
Proceedings of the Ocean Drilling Program, Scientific Results