Shipboard Scientific Party
Large igneous provinces (LIPs) are the result of massive magmatic events, capable of effecting major environmental changes on a global scale. The Kerguelen Plateau/Broken Ridge LIP is the second largest LIP on Earth, and is thought to have been formed through mafic magmatism in Cretaceous time (Coffin & Eldholm, 1994). The Kerguelen Plateau is subdivided in several segments due to structural differences and temporal evolution (Coffin et al., 1986; in prep.): Southern Kerguelen Plateau, Central Kerguelen Plateau, Northern Kerguelen Plateau, Skiff Bank, Elan Bank and Labuan Basin (Figure 1).
The principle objectives of ODP Leg 183 were to determine:
The drilling strategy was to sample igneous basement at as many morphologically and tectonically distinct regions of the Kerguelen Plateau/Broken Ridge LIP as possible on one drilling leg. Five holes (1135-1140) were drilled through the overlying sedimentary cover and 100-150 m into basement on each segment of the Kerguelen Plateau (Figure 1); three of the holes were logged. Two holes (1141/1142) were drilled on Broken Ridge, but were not logged. The main scientific results can be found at the 'Ocean Drilling Program' and in Coffin, Frey, Wallace, et al., (in prep).
Figure 1: Gravity map showing the locations of the sites on the Kerguelen Plateau drilled during Leg 183 (Coffin, Frey, Wallace, et al., 1999) and its precursor Legs 119 (Barron, Larson, et al., 1989) and 120 (Schlich, Wise, et al., 1989)
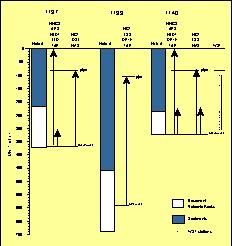
The logging program was reduced due to time constrains and bad weather conditions. Figure 2 gives an overview of the logged sections at Sites 1137, 1139, and 1140 in relation to the simplified sediment and basement section.
Figure 2: Logging Summary. The arrows indicate the runs and the measurement direction (all uplog); for the abbreviations used see text.
After waiting for weather conditions to calm down for the use of the Wireline Heave Compensator (WHC) we started the logging operation (Figure 2). The first run was the triple combo including the HNGS (spectral gamma-ray), APS (neutron porosity), HLDT (density), DLL (resistivity), and the Lamont Temperature Tool (TAP). Good hole condition allowed us to deploy the FMS-DSI (sonic velocity) combination in the second run. During the first pass of the FMS-DSI combination the caliper measurements indicated more bridges above the sediment/basement transition (150-200 mbsf). These bridges were probably caused by swelling of clays and prevented a second pass with the FMS-DSI combination.
The data in the sedimentary section are of poor quality because of the great enlargement of the hole, which exceeded 19 in. The maximum aperture of the triple combo is 19 inch, and only 15 inch for the FMS/sonic combination. The logging data in the basement are of excellent quality, since no irregular borehole wall influenced the measurements (Figure 3). High readings in the natural gamma-ray mark a horizon with glauconitic sand on top of the basement (194-228 mbsf). The transition to the basement is clearly distinguished by all logging data. Within the basement the 10 igneous units delineated in the cores could be also distinguished by the downhole measurements. Variations in density, velocity, resistivity, and neutron porosity reflect internal changes in the basaltic lava flows. Highly altered flow tops are characterized by increased potassium content due to its enrichment in clay minerals. The FMS images show the different lithologies clearly, including lava flows, cobbles in the conglomerate, and sandy volcaniclastic interbeds (Figure 4). Within single lava flows the FMS images reflect structural changes (Figure 5), like vesicularity, fracturing, and brecciation. The FMS images allow good core-log integration, which enables us to revise flow thickness calculated from curation depth.
Figure 3: Logging results from Hole 1137
|
|
|
|
Figure 4: Individual pebbles in the volcaniclastic conglomerate as well as the sandy volcaniclastic interbed are clearly seen in the FMS image. |
Figure 5: Electrical image showing detailed structures, such as vesicularity and fractures, within the subaerial erupted basaltic lava flow of Basement Unit 2B. |
After finishing the wiper trip and releasing the bit the wireline tools were rigged up. Due to rough seas we decided not to use the Triple Combo to prevent damage to its calipers, and because of the risk of losing the radioactive source. Instead we used the DITE-DSI-NGT (resistivity, velocity, natural gamma-ray) combination. When we started logging up the hole, the computer was not able to communicate with the tools in the hole and the tool had to be retrieved. The DSI (Dipole Shear Sonic Imager) was replaced by the LSS (Long-Spaced Sonic) and we went back into the hole. We could not pass a bridge at 592 mbsf, right above the transition to the basalts. Thus, we started to log from 592 mbsf to the end of pipe at 101.7 mbsf. The seas were too rough to run the wireline heave compensator, however, the data could be corrected by the acceleration measurements from the Lamont Temperature/Acceleration/Pressure Tool (TAP).
Figure 6a & 6b gives an overview of the results of the single logging run. It is important to bear in mind that no caliper log exists for data corrections and quality control. Lithologic Units II to VI can be clearly distinguished from the logging data (Figure 7). As expected, the lowest natural gamma-ray is found in the pelagic sediments of Unit II (47.5-380.72 mbsf). Starting in Unit III (380.72-383.5 mbsf) the natural gamma-ray tends to increase steadily downhole, showing the highest values in Unit VI (461.7-694.2 mbsf) at ~518 mbsf. An unusual petrologic feature at Site 1139 is the recovery of alkaline volcanic rocks. The upper part of Unit VI (volcanic basement) is composed of felsic volcanics which are enriched in thorium and potassium. Volcanic units 1-5 can be distinguished by different contents of thorium, uranium, and potassium. Units 2 and 4 are enriched in K-Feldspar, and in fact, they show the highest values in the potassium log. The radioactive nuclides are also affected by pervasive alteration which leads to variations in the chemical composition of the rocks. Unit 1E, for example, shows high thorium contents, which might be related to precipitation along observed fault zones. Besides the geochemistry, alteration affects the resistivity and velocity measurements, particularly when the alteration is related to structural variations, for example, grain size differences and faulting.
|
|
|
|
Figure 6a & 6b: Overview of the logging data. |
|
Figure 7: Correlation of the log data with the Basement Units. The low core recovery does not reveal true thickness and the logs could refine and partly confirm the core description.
Three logging runs were successfully deployed (Figure 2). The first run included the Triple Combo (resistivity, density, porosity), the natural gamma-ray tool, and the Lamont TAP tool. A repeat pass was made in the basement section. The second logging run included the natural gamma-ray, the LSS (sonic) and the FMS tool. A repeat run was made in the basement section. The third logging run was the check shot survey (WST, well seismic tool). Eight stations with ~ 10 m spacing in the basement and two stations in the sediments were used to record the travel time of the signal triggered by the 300 cubic inch airgun.
All logging data are of excellent quality in the basement section (Figure 8). The repeat runs reproduced all features. The overlying sediments were mostly washed out and the caliper log shows that the tools often had no contact with the borehole wall. In the sediments the logging data show nearly no variation, which is consistent with the core description. In the basement the logging data can be used to distinguish the six basement units that had been identified in the cores (Figure 9). For example, density, resistivity, and velocity measurements are high in the basalts. They drop in sedimentary beds and also when the tools encounter thick pillow rims. The electrical images show the different lithologies in the basement very well, e.g. pillow lavas (Figure 10), massive lava flows, fractures, sedimentary interbeds can be seen and the thickness of the individual units can be estimated. The well seismic experiment enables us to calculate the time-depth conversion to tie the logging data to reflection seismic lines. In Figure 11 an excellent correlation of the two basement reflectors in the seismic profile and in the synthetic seismogram can be seen.
|
|
|
|
Figure 8: Overview of the standard logging data. |
Figure 9: Correlation of the logging data with the core lithology. It is evident that the sedimentary interbeds were undersampled. |
|
|
|
|
Figure 10: FMS image shows pillowed structures within a submarine erupted lava flow. |
Figure 11: The synthetic seismogram, performed by the depth-time conversion using the check-shot data, shows a good correlation with the seismic reflection data from Marion Dufresne cruise 109, line 06, across Site 1140. |
ODP Logging Scientist:
Heike Delius: Applied Geophysics, RWTH Aachen, 52056 Aachen, Germany,
e-mail: heike@sun.geophac.rwth-aachen.de
References
Barron, J., Larson, B., and Shipboard Scientific Party (1989) Proc. ODP, Init. Repts., 119: College Station, TX (Ocean Drilling Program).
Coffin, M.F., Pringle, M.S., and Storey, M.S., in prep. Kerguelen hot spot magma output since 130 Ma, Science.
Coffin, M.F., Frey, F.A., Wallace, P.J., and Shipboard Scientific Party (1999) Proc. ODP, Init. Repts., 183: College Station, TX (Ocean Drilling Program).
Coffin, M.F. & Eldholm, O. (1994) Large igneous provinces: crustal structure, dimensions, and exter-nal consequences. Rev. Geophys., 32:1-36.
Coffin, M.F., Davies, H.L., & Haxby, W.F. (1986) Structure of the Kerguelen Plateau province from SEASAT altimetry and seismic reflection data. Nature, 324:134-136.
Schlich, R., Wise, S.W., and Shipboard Scientific Party (1989) Proc. ODP, Init. Repts., 120: College Station, TX (Ocean Dril-ling Program).
Proceedings of the Ocean Drilling Program, Initial Reports
Proceedings of the Ocean Drilling Program, Scientific Results