IODP
Expedition 306: North Atlantic
Climate II |
Figure
7 |
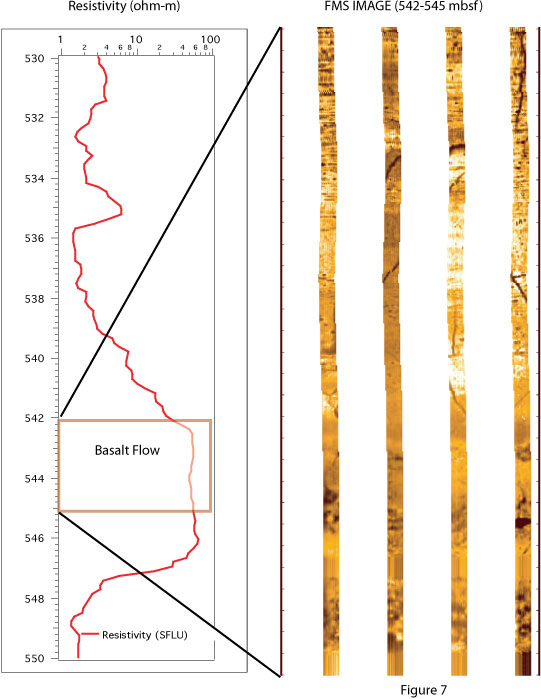
Detailed resistivity profile over an interval from 530 to 550 mbsf at Hole 642E showing the pattern of basalt flows with a lower resistivity at the top and increasing towards the bottom. A blowup of a FMS image showing fine-grained basalt interval between 542 to 545 mbsf |
 |