IODP
Expedition 309/312: Superfast Spreading
Rate Crust 2 and Superfast Spreading Rate Crust 3
Figure
7
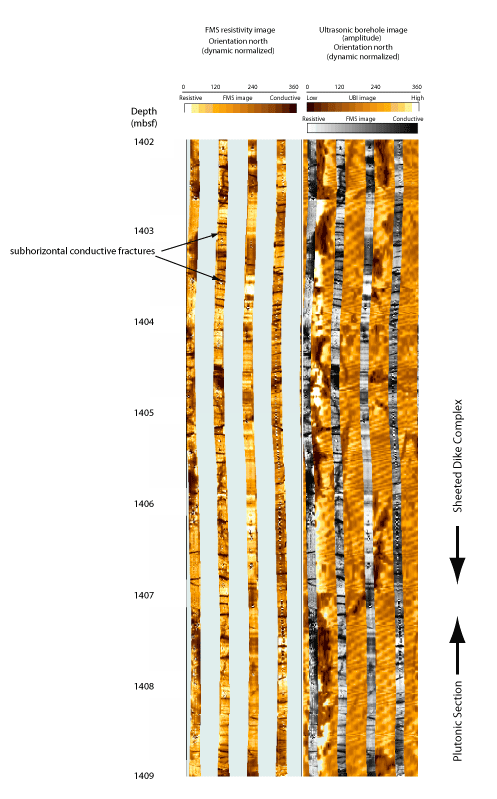
Formation MicroScanner (FMS) resistivity and sonic Ultrasonic Borehole Imager (UBI) images (static normalized) showing the depth range 1402–1409 mbsf covering the sheeted dike-gabbro transition described on recovered samples. FMS data (static normalized grey scale) obtained during logging pass 2 (see Figure 3) are overlain the UBI image for comparison.
