IODP
Expedition 336: Mid-Atlantic Ridge Microbiology |
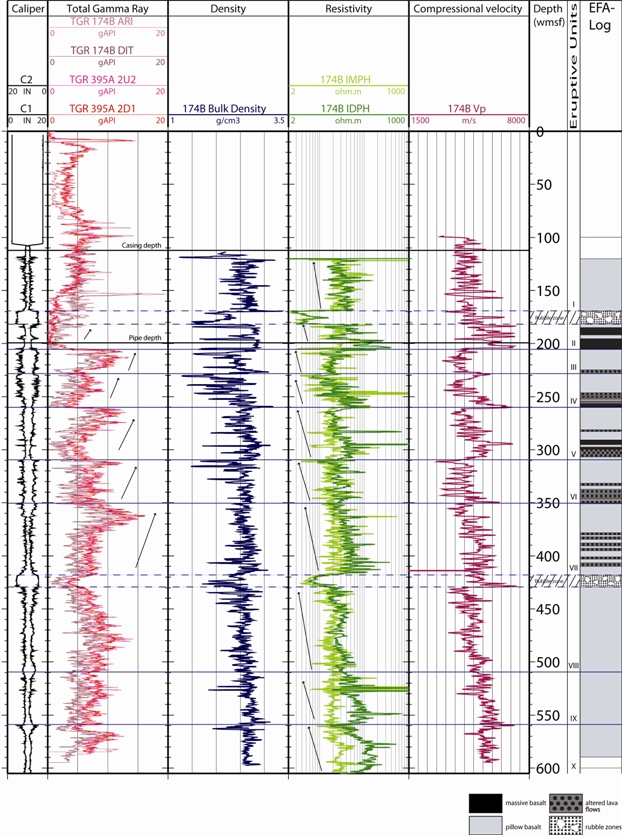
Figure
2 |
Summary of Hole 395A logging results. Blue lines = eruptive unit divisions (after Bartetzko et al., 2001), black lines = limits of casing and pipe for Expedition 336 operations. Arrows mark trends in gamma ray and resistivity. Measurements include borehole diameter (C1, C2 = FMS pass [Leg 174B]), gamma ray (TGR 174B ARI = total gamma ray counts from Azimuthal Resistivity Imager tool string [Leg 174B]; TGR 174B DIT = total gamma ray counts from Dual Induction Sonde tool string [Leg 174B]; TGR 395A 2U2 = total gamma ray counts from microbiology combination tool string Run 2, Uplog 2 [Expedition 336]; TGR 395A 2D1 = total gamma ray counts from the microbiology combination tool string Run 2, Downlog 1 [Expedition 336]), bulk density (Leg 174B), resistivity (174B IMPH = medium induction phasor-processed resistivity, 174B IDPH = deep induction phasor-processed resistivity [both Leg 174B]), and P-wave velocity (174B VP = compressional wave velocity measured with downhole sonic sonde [Leg 174B]). A summary of core recovery and lithologic units is provided at far left (after Shipboard Scientific Party, 1979, fig. 9). DSDP = Deep Sea Drilling Project. Electrofacies (EFA) log after Bartetzko et al. (2001). |