IODP
Expedition 311: Cascadia Margin Gas Hydrates
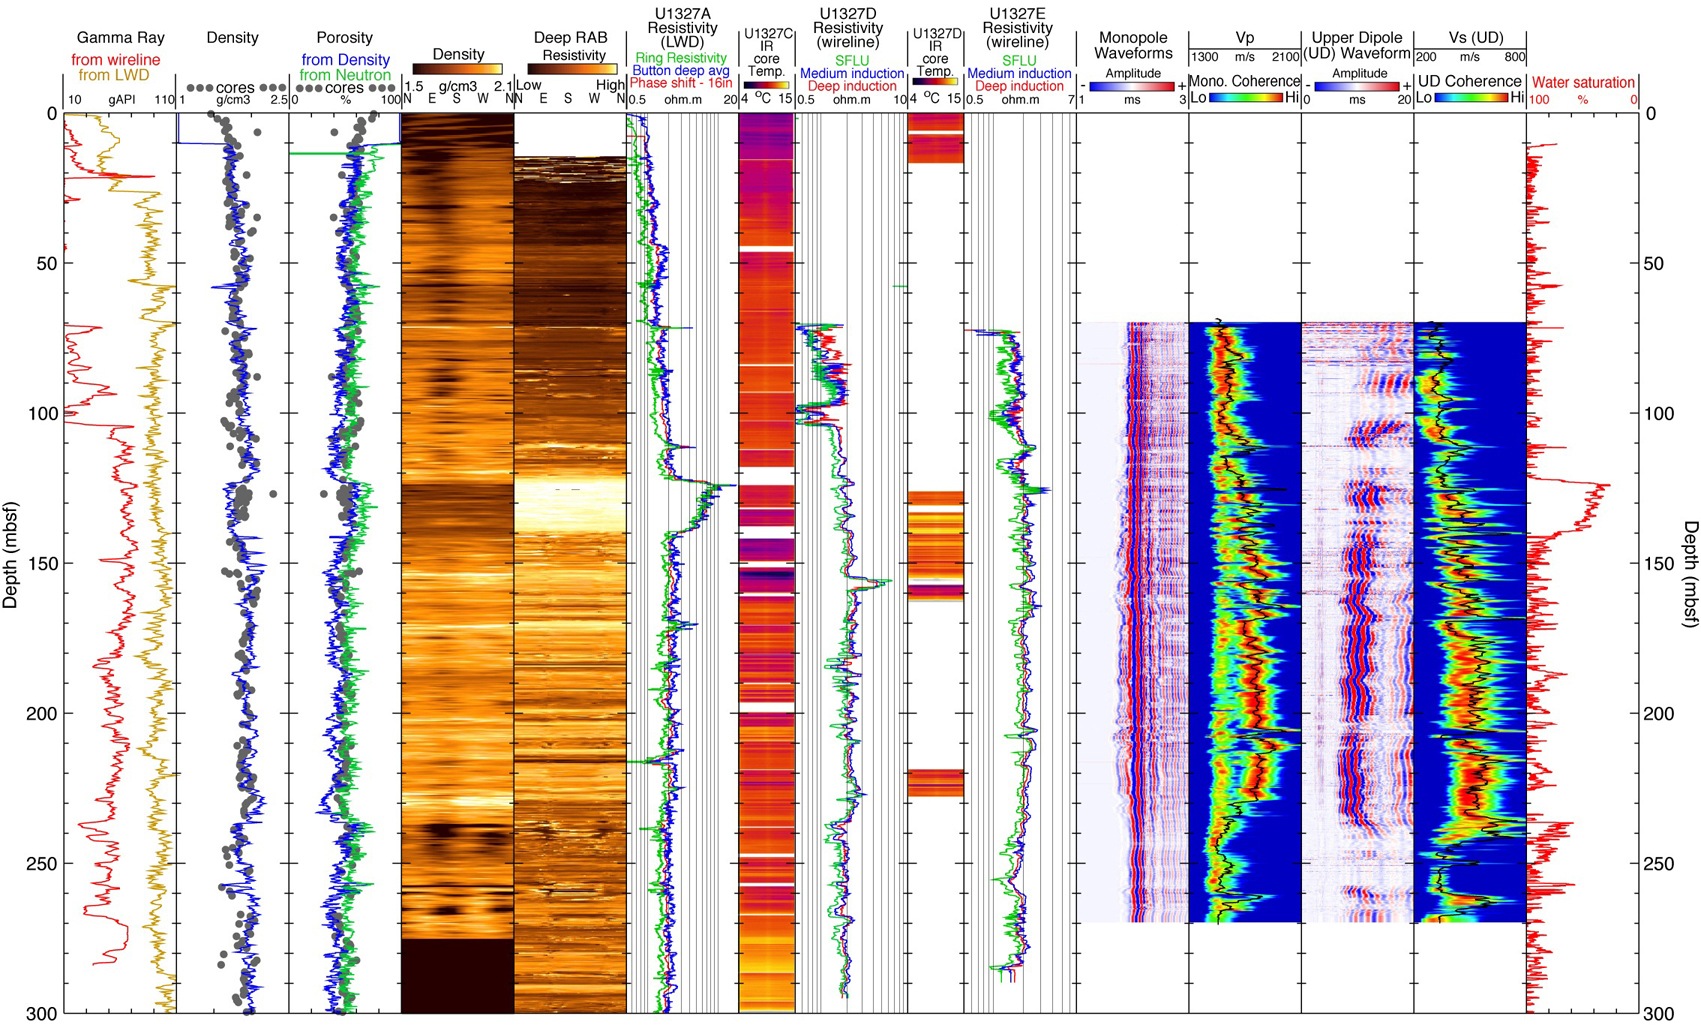
Figure
7
Summary
of the logging data recorded at Site U1327. In the resistivity column,
the Deep Induction and SFLU (Spherically Focussed Log Unfiltered)
curves were recorded with the wireline tools, the others with LWD.
The comparison of the Infra Red (IR) images from hole U1327C and
U1327D with the resistivity logs acquired in holes U1327A, U1327D
and U1327E illustrates the strong lateral heterogeneity of gas hydrate
distribution at this site.