IODP
Expedition 311: Cascadia Margin Gas Hydrates
Figure
9
Summary
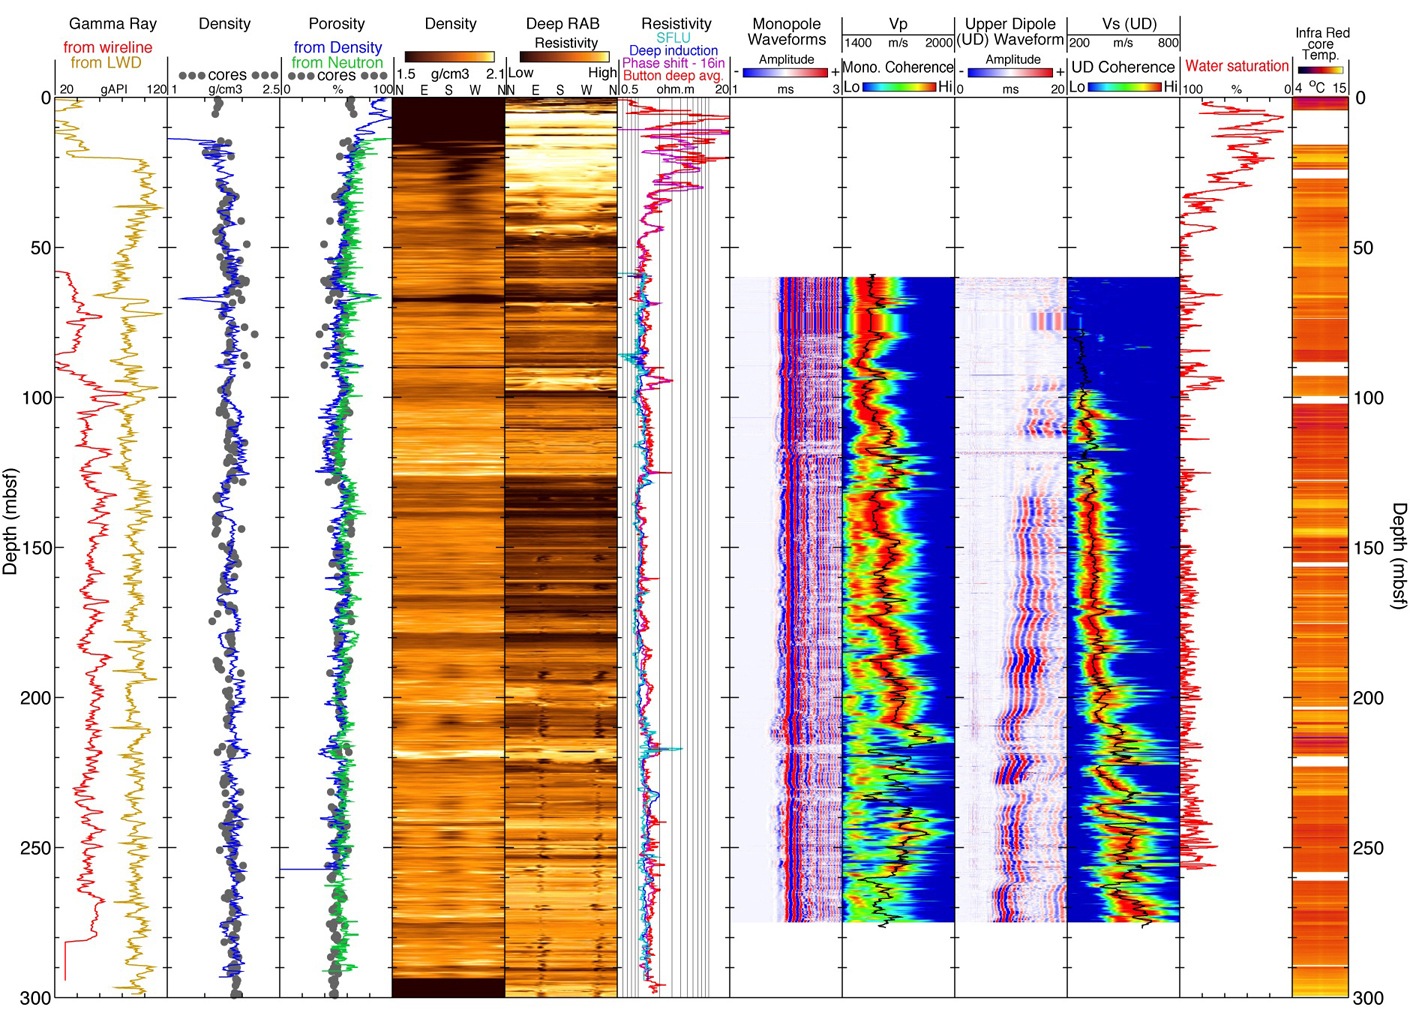
of the logging data recorded at Site U1328. In the resistivity column,
the Deep Induction and SFLU (Spherically Focussed Log Unfiltered)
curves were recorded with the wireline tools, the others with LWD.
The last column on the right is a compilation of the Infra Red (IR)
images recorded on the core liner of the recovered sections to detect
gas hydrate.