Logging Summary
|
| IODP Expedition 339: |
|
Mediterranean Outflow
Expedition 339
Scientific Party
|
| Introduction |
|
|
|
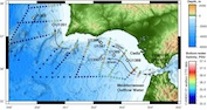
Figure 1.
Bathymetry map of the Gulf of
Cádiz, showing locations of the
sites and paths of Mediterranean
Outflow..
|
The Gulf of Cádiz was targeted for the
investigation of Mediterranean Outflow
through the Strait of Gibraltar gateway
and its influence on global circulation
and climate. As the direct result of
Mediterranean Outflow, the Gulf of Cádiz
contourite depositional system (CDS) has
developed at very high rates of sediment
accumulation over the past 5 m.y.,
providing an expanded sedimentary record
that permits detailed examination of
paleocirculation patterns linked to past
environmental change. During Integrated
Ocean Drilling Program Expedition 339,
five sites were drilled in the Gulf of
Cádiz and two sites were drilled off the
West Iberian margin from November 2011
to January 2012.
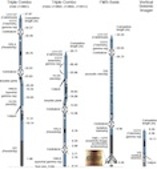
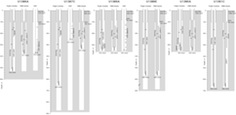
Downhole logging was carried out at
five of the sites (Figure 2, Figure 3).
Scientific highlights include records of
cyclic sedimentation in contourite
drifts through time, and linking the
site lithostratigraphy to the seismic
profiles using checkshot surveys and
velocity logs. Technical highlights
include evaluating the new HRLA
resistivity tool in low-resistivity
formations by comparison to DIT
resistivity results, and evaluating the
effects of borehole conditions at one
site where two contrasting holes were
logged (one mostly in gauge, and the
other washed out to wide diameter).
Table 1. Logging
operations summary, Expedition 339.
Hole |
Date of logging
|
Water
Depth (below rig floor)
|
Hole
Depth (below sea floor)
|
Maximum
Logged Depth
|
Tool Strings
|
|
|
|
|
|
|
|
U1386C
|
Dec 7, 2011
|
573
|
526
|
526
|
TC, FMS, VSP
|
|
U1387C
|
Dec 16, 2011
|
569
|
870
|
650
|
TC, VSP, FMS
|
|
U1389A
|
Dec 23, 2011
|
656
|
355
|
355
|
TC, FMS, VSP
|
|
U1389E
|
Jan 1, 2012
|
655
|
990
|
568
|
TC, FMS
|
|
U1390A
|
Jan 4, 2012
|
1004
|
350
|
350
|
TC, FMS
|
|
U1391C
|
Jan 14, 2012
|
1085
|
671.5
|
669
|
TC, FMS
|
|
 |
|
Figure
3. Graphic
representation of the logging
operations during Expedition
339.
|
|
|
| Figure 2. Tool
string combinations used during
Expedition 339. |
|
|
Logging Results
|
|
|
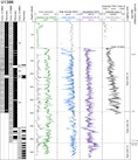
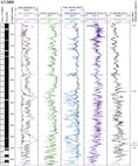
Figure 4. U1386C downhole
logs and corresponding physical
property data from measurements
on sediment cores..
|
U1386C
Coring at Site U1386 on the Faro Drift
recovered a thick succession of mud/silt
contourites showing a continuous record
of drift sedimentation over the past 1.9
m.y. down to 463 mbsf. Unconformities
separate the Pleistocene from Pliocene
and late Miocene sediments in the lower
60 m of the hole.
Downhole measurements were made in Hole
U1386C to a total depth of 526 mbsf (Fig. 4).
Despite numerous washouts of the
borehole wall, the logs closely reflect
both lithologic changes and cementation
recorded in the recovered cores. This
allowed us to infer lithologies from
some of the gaps in core recovery,
because high natural gamma radiation
(NGR) values correlate to layers with
high clay content, and lower NGR values
correlate to coarser layers (usually
contourites in this environment during
the Pleistocene). Preliminary inspection
also revealed a marked cyclicity from
102 to 346 mbsf through the contourite
section, which seems to relate to
Milankovitch precession cycles of ~20
k.y.
|
|
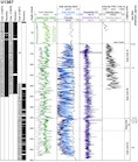
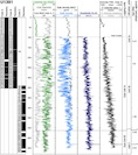
| Figure 5.
U1387C downhole logs and
corresponding physical property
data from measurements on
sediment cores. |
U1387C
This site lies 4 km southeast of Site
U1386 on the same sediment drift, but
has an expanded Pliocene succession.
Meter-scale bi-gradational contourite
cyclicity was common, with evidence of a
strong lateral supply of terrigenous
material to the bottom currents,
especially before ~1.8 Ma.
Downhole Triple Combo measurements were
made in Hole U1387C to a bridge in the
hole at 649 mbsf; subsequent tool
strings encountered bridges at shallower
depths. The borehole contained many
washouts and was often wider than the
caliper arms (18 inches), which meant
that the quality of the density and
porosity logs was very poor. Other logs
(NGR, resistivity, sonic velocity) were
affected to a lesser degree (Fig. 5).
As at the other Exp. 339 sites, NGR
measurements were made in the upper part
of the hole through the pipe (Fig. 5). The
NGR signal is attenuated by the metal in
the pipe and bottom-hole assembly. This
attenuation can be corrected at these
sites by multiplying by a factor of 5,
to bring the NGR values into line with
the open-hole values. Features in the
downhole NGR record compare well to
those measured on core.
In the upper part of the Pliocene
logged section (~3.8 to 3.2 Ma, 462-600
mbsf) the cyclic pattern observed on NGR
logs seems to reflect lithologic cycles
(dark-light cycles in interbedded
turbidites and contourites). Although
some depth adjustments may be locally
required, high NGR values appear to
correlate relatively well with thick
intervals of very dark greenish gray
nannofossil mud, probably because of
high clay content in this lithology. For
example, dark greenish layers observed
at ~536.5, 539, and 542 mbsf probably
tie with logged gamma peaks centered at
535, 539, and 542 mbsf.
Marking the hiatus between Pleistocene
and Pliocene sediments, two dolostone
beds appear as a double peak of high
resistivity values at 461.1 and 462.6 m,
and the highest uranium content of the
entire hole (close to 3 ppm) is observed
between the peaks
U1389A and U1389E
|
|
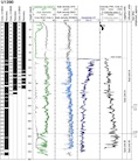
| Figure 6.
U1389A and U1389E downhole logs
and comparison of logs taken under
between in-gauge and wide borehole
conditions, respectively. |
Site U1389 is located in the “channels
and ridges” sector of the larger Cádiz
contourite depositional system, and is
perched on a relative topographic high,
which is currently elevated 50-250 m
above the flanking contourite channels.
Hole U1389E reached ~3.8 Ma at 990 mbsf.
Logging was carried out at two holes at
this site: in Hole U1389A to 355 mbsf
and in Hole U1389E to a bridged-hole
depth of 568 mbsf. This allowed
comparison of logging data in
contrasting borehole conditions. Hole
U1389A was an APC/XCB hole drilled with
a PDC bit, resulting in a good-quality
in-gauge with good logging data that
matched well to the corresponding data
measured on cores. Hole U1389E was an
RCB hole that needed a lot of water
pressure to keep the roller-cones free
of clay build-up, resulting in a wide
and frequently washed out hole. Thus the
degree to which hole diameter affects
downhole logs can be seen in the
overlapping logged interval (Fig. 6):
- The total natural gamma radiation
(HSGR) logs have lower values in the
wider hole, but in general the same
trends and patterns are seen in the
HSGR logs from both holes. Correction
for hole diameter is possible based on
the caliper logs, although very good
depth control is needed for this to be
successful in rough holes like U1389E.
Moreover, it is not possible to
accurately correct for hole sizes
greater than the 18 inch caliper
limit.
- The bulk density logs offer a stark
contrast between the two holes. In
Hole U1389A, bulk density values
typically match the moisture and
density (MAD) bulk density values. In
the wider parts of Hole U1389E, the
sensors were unable to make good
contact with the borehole wall and
consequently read values as low as
1.15 g/cm3, close to borehole fluid
value. Where the holes are relatively
smooth and not too wide, the log bulk
density values overlay very closely
(e.g., 195-215 mbsf).
- Electrical resistivity is measured
by the HRLA at five different depths
of investigation. The deepest
measurement (RLA5) is least affected
by variations in borehole diameter. In
general, the RLA5 logs from both holes
overlay each other reasonably well,
but the Hole U1389E log is noisier and
drops to lower values in thin, washed
out zones, as well as peaking to
higher values where the hole narrows.
An additional HRLA log, the “true
resistivity” computed from the five
deep-to-shallow reading measurements
(not shown in the figure), apparently
overcorrects, providing resistivity
values in Hole U1389E that are higher
than in Hole U1389A.
- The sonic velocity logs from the two
holes give well-matched patterns and
values in the upper part of the common
section (100-220 mbsf). In the
washed-out zones below 220 mbsf in
Hole U1389E, velocity is sometimes
underestimated, perhaps caused by a
longer path for the sonic wave to
travel. In the rough and wide 220-320
mbsf section, Hole U1389E velocities
are on average 3.2% slower than those
in Hole U1389A. Even though the
velocity data repeat very well between
Passes 1 and 2 in Hole U1389E, this is
not necessarily a good indication that
they are recording the true formation
velocity well, rather that the two
passes respond similarly to the hole
conditions. Another note of caution is
that the washed out zones tend to be
sand-rich layers; thus their
velocities would be underestimated
more than those of other lithologies.
A good suite of FMS image logs was
obtained in Hole U1389A.Conductive beds
on the FMS images correlate with lower
values in the NGR log, lower bulk
densities, lower resistivities, lower P-wave
velocities (e.g., two conductive
intervals from 317 to 320 and 326 to
328.5 mbsf in Fig.
6) and correspond to
coarse-grained intervals (sands and
silts). There is a distinct change in
log characteristics at ~320 mbsf, which
correlates closely with a
lithostratigraphic boundary and a zone
of poor core recovery. This zone appears
to be more sand rich on the basis of
borehole logs, although no sands were
recovered by coring. At the scale of the
holes, the FMS images have a downhole
trend of increasing conductivity,
especially below 320 mbsf, that we
possibly relate to the progressive
downhole increase in pore water
salinity.
U1390
|
|
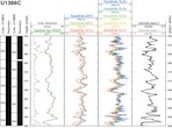
| Figure 7.
U1390A downhole logsand
corresponding physical property
data from measurements on sediment
cores. |
Site U1390 is the companion to Site
U1389, also located under the lower
branch of Mediterranean Outflow. Site
U1390 is located near the western end of
a sheeted drift adjacent to the
Guadalquivir contourite channel at 300 m
above the channel floor. With maximum
sedimentation rates of 85 cm/k.y., and
perhaps in excess of 100 cm/k.y., these
are the highest known rates for
contourite drifts anywhere.
Downhole measurements were made in Hole
U1390A to 350 mbsf with good quality
data obtained as a result of good hole
conditions, especially in the upper 270
m (Fig. 7).
There is a distinct change in log
characteristics at ~290 mbsf, which
correlates closely with the lithologic
boundary between subunits and the change
downhole to a more sand-rich lithology.
Distinct cyclicity is apparent in some
parts of the section, corresponding with
both lithologic and physical property
data.
This site was notable for a downhole
decrease in resistivity, which, as for
site U1389, we attribute to high
salinity pore waters in the lower part
of the hole. High salinity values were
also seen in the pore-water geochemistry
data, perhaps indicating subsurface flow
from a source of highly saline water.
|
|
| Figure 8.
U1391C downhole logs and
corresponding physical property
data from measurements on sediment
cores.. |
U1391
Site U1391 is located to the west of
Portugal and is the most distal of the
drilled sites under the influence of
MOW. Coring reached 672m into an
extensive plastered drift, dated at ~3.5
Ma at the base of the hole. Although it
is distinctly more mud rich than at the
sites in the Gulf of Cádiz, the
sedimentation rates are as high as Sites
U1386 and U1387, and contourites still
dominate the succession.
Downhole measurements were made in Hole
U1391C to 668 mbsf, almost the bottom of
the hole. The borehole was very rugose
with many narrow washouts that affected
log quality. Minor changes in log
characteristics occur at ~562 mbsf,
which correlates to a lithologic
boundary at about 2.5 Ma. The deeper
interval has generally lower NGR values
and includes two zones with poor core
recovery that may be more sand-rich on
the basis of borehole logs, although no
sands were recovered by coring. Distinct
cyclicity is apparent in some parts of
the section, corresponding to cyclicity
in both lithologic and physical property
data.
Comparison of the HRLA and
DIT-SFL resistivity logs
|
|
| Figure 9.
Comparison of resistivity data
from the DIT tool (SFLU, IMPH and
IDPH) and the HRLA tool (RLA1-5). |
The Schlumberger HRLA resistivity tool
was run in high-resistivity ocean crust
on the two most recent JOIDES
Resolution IODP expeditions (335
and 336) but until Expedition 339 had
not been run in unconsolidated
sediments. Previous generations of
laterolog, such as the Dual Laterolog,
were not designed for low-resistivity
unlithified sedimentary formations such
as those encountered during IODP
expeditions. However, the HRLA
measurement range extends to low
resistivities and therefore is more
suitable for IODP use. In Hole U1386C,
we obtained both HRLA and DIT-SFL
resistivity logs in order to compare
absolute resistivity values, vertical
resolutions, and effects of washouts.
Overall, the two sets of logs show the
same resistivity trends and fluctuations
in Hole U1386C (Fig.
9). The deep-reading resistivity
log of the HRLA have a higher vertical
resolution(~30 cm) compared to the DIT
(~240 cm). The deep reading DIT
resistivity follows almost exactly the
lower envelope the HRLA deep resistivity
values. The shallow-reading logs from
both tools have lower resistivity values
than the deep-reading logs, as expected,
because the shallow-reading logs sample
proportionately more seawater and less
formation than the deep-reading logs.
The separation of the shallow and deep
HRLA log values is much reduced where
the borehole diameter is in gauge (e.g.,
285 mbsf) and expanded where the hole is
washed out (e.g., 259 mbsf) or rugose
(e.g., 268 mbsf), as is also the case
for the DIT-SFL logs. The features in
the HRLA resistivity logs were
cross-checked against the velocity logs:
they match very well in both.
|
|
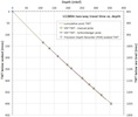
| Figure 10.
Sonic two-way-time (TWT) vs. depth
at Hole U1389A. |
VSP, Velocity profiles
Understanding the sedimentary
architecture of the contourite
depositional system in the Gulf of Cádiz
is a major objective of Expedition 339.
To achieve this, the lithostratigraphic
packages and hiatuses have to be dated
and linked to stratigraphic units in the
seismic profiles that criss-cross the
area. The link to the seismic profiles
requires conversion from depth in the
borehole to two-way traveltime (TWT) in
the seismic. Figure
10 illustrates the results of two
methods for this conversion at Hole
U1387A: 1) vertical seismic profile
checkshots, and 2) the integrated
velocity log. The methods give reliable
results, despite sometimes less than
ideal borehole conditions.
Temperature measurements
In-situ sediment temperature data were
measured during 55 deployments of the
APCT on Expedition 339. The geothermal
gradient at the Exp. 339 sites varies
from 14°C/km (at Site U1391) to 34°C/km
(at Site U1386), a wide range that
reflects tectonic processes in the Gulf
of Cádiz area. The data also provide
estimates of the average bottom-water
temperature, representing the
temperature of Mediterranean Outflow
water, over the last century or so.
|
Trevor Williams:
Logging Staff Scientist, Borehole
Research Group Lamont-Doherty Earth
Observatory of Columbia University, PO
Box 1000, 61 Route 9W, Palisades, NY
10964, USA
Johanna Lofi: Logging
Scientist, Géosciences Montpellier - UMR
5243 - CC 060 - Bat. 22, Université de
Montpellier 2, Place E. Bataillon, 34095
Montpellier Cedex 05, France
|
|
|