Leg 118: Geochemical Processing Report
Note: A complete revision of all of the processed data from this leg was performed before putting the data online. This may have resulted in minor depth discrepancies between the published geochemical data and the online database version, particularly before Leg 128.
The following is simply an account of the steps generally carried out in geochemical processing. Because no geochemical data paper was published in the Scientific Results volume of Leg 118, there is no mention of specific procedures and/or problems encountered during the processing of Hole 735B. Information about the geochemical units encountered in this hole is found in Robinson, P. T., Von Herzen, R. et al (1989), Proc. ODP, Prelim. Results, 118: College Station, TX (Ocean Drilling Program), 89-222.
Geochemical Tool String
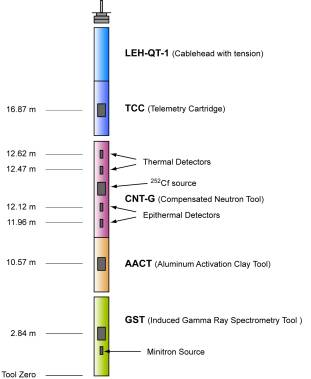
The Schlumberger geochemical tool string consists of four logging tools: the natural gamma-ray tool (NGT) the compensated neutron tool (CNT), the aluminum activation clay tool (AACT), and the gamma-ray spectrometry tool (see figure below). The natural gamma-ray tool is located at the top of the tool string, so that it can measure the naturally occurring radio nuclides, Th, U, and K, before the formation is irradiated by the nuclear sources contained in the other tools below. The compensated neutron tool, located below the natural gamma-ray tool, carries a low-energy californium source (252Cf) to activate the Al atoms in the formation. The aluminum activation clay background radiation is subtracted out by the aluminum activation clay tool below and a reading of formation Al is obtained (Scott and Smith, 1973).
The gamma-ray spectrometry tool, at the base of the string, carries a pulsed neutron generator to bombard the borehole and formation and an NaI(Tl) scintillation detector, which measures the spectrum of gamma-rays generated by neutron-capture reactions. Because each of the elements measured (silicon, iron, calcium, titanium, sulfur, gadolinium, and potassium) is characterized by a unique spectral signature, it is possible to derive the contribution (or yield) of each of them to the measured spectrum and, in turn, to estimate their abundance in the formation. The GST also measures the hydrogen and chlorine in the borehole and formation, but the signal for these elements is almost entirely due to seawater in the borehole, and they are hence of little value.
The only major rock-forming elements not measured by the geochemical tool string are magnesium and sodium; the neutron-capture cross-sections of these elements are too small relative to their typical abundance for the tool string to detect them. A rough estimate of Mg+Na can be made by using the photoelectric factor (PEF) measured by the lithodensity tool. This measured PEF is compared with a calculated of PEF (a summation of the PEF from all of the measured elements). The separation between the measured and calculated PEF is, in theory, attributable to any element left over in the formation (i.e., Mg, and Na). Further explanation of this technique is found in Hertzog et al. (1989).
Data Reduction
The well log data from the Schlumberger tools have been transmitted digitally up a wireline and recorded on the JOIDES Resolution in the Schlumberger Cyber Service Unit (CSU). The results from the CSU have been processed to correct for the effects of drilling fluids, logging speed, and pipe interference. Processing of the spectrometry data is required to transform the relative elemental yields into oxide weight fractions. The processing is performed with a set of log interpretation programs written by Schlumberger that have been modified to account for the lithologies and hole conditions encountered in ODP holes. The processing steps are summarized below:
Step 1: Reconstruction of relative elemental yields from recorded spectral data
The first processing step uses a weighted least-squares method to compare the measured spectra from the geochemical spectrometry tool with a series of standard spectra in order to determine the relative contribution (or yield) of each element. Whereas six elemental standards (Si, Fe, Ca, S, Cl, and H) are used to produce the shipboard yields, three additional standards (Ti, Gd, and K) can be included in the shore-based processing to improve the fit of the spectral standards to the measured spectra (Grau and Schweitzer, 1989). Although these additional elements often appear in the formation in very low concentrations, they can make a large contribution to the measured spectra, because they have large neutron-capture cross-sections. For example, the capture cross-section of Gd is 49,000 barns, that of Si 0.16 barns (Hertzog et al., 1989). Gd is, therefore, included in the calculation of a best fit between the measured and the standard spectra.
The recomputed yields are loaded in the file 735B-yields.dat.
Step 2: Depth-shifting
Geochemical processing involves the integration of data from the different tool strings; consequently, it is important that all the data are depth-correlated to one reference logging run. A total gamma-ray curve (from the gamma-ray tool, which is run on each tool string) is usually chosen as a reference curve, based on cable tension (the logging run with the least amount of cable sticking) and cable speed (tools run at faster speeds are less likely to stick).
The reference logging run at Hole 735B was the LDT/CNTG/NGT logging string.
Step 3: Calculation of total radioactivity and Th, U, and K concentrations
The third processing routine calculates the total natural gamma radiation in the formation as well as concentrations of Th, U, and K, using the counts in five spectral windows from the natural gamma-ray tool (Lock and Hoyer, 1971). This resembles shipboard processing, except that corrections for hole-size changes are made in the shore-based processing of these curves. A Kalman filter (Ruckebusch, 1983) is applied to minimize the statistical uncertainties in the logs, which would otherwise create erroneous negative readings and anti-correlation (especially between Th and U). At each depth level calculations and corrections also were performed for K contained in the mud. This K correction is particularly useful where KCl is routinely added to the borehole fluid to inhibit clay swelling.
The outputs of this program are: K (wet wt %), U (ppm), and Th (ppm), along with a total gamma-ray curve and a computed gamma-ray curve (total gamma-ray minus U contribution).
The processed gamma-ray data are loaded in the file 735B-ngt.dat.
Step 4: Calculation of Al concentration
The fourth processing routine calculates an Al curve using four energy windows, while concurrently correct for natural activity, borehole fluid neutron-capture cross-section, formation neutron-capture cross- section, formation slowing-down length, and borehole size. Porosity and density logs are needed in this routine to convert the wet weight percent K and Al curves to dry weight percent.
A correction is also made for Si interference with Al; the 252Cf source activates the Si, producing the aluminum isotope, 28Al (Hertzog et al., 1989). The program uses the Si yield from the gamma-ray spectrometry tool to determine the Si background correction. The program outputs dry weight percentages of Al and K, which are used in the calculation and normalization of the remaining elements.
Step 5: Normalization of elemental yields from the GST to calculate the elemental weight fractions
This routine combines the dry weight percentages of Al and K with the reconstructed yields to obtain dry weight percentages of the GST elements using the relationship:
Wi = F Yi/Si
where
| Wi | = | dry weight percentage of the i-th element |
| F | = | normalization factor determined at each depth interval |
| Yi | = | relative elemental yield for the i-th element |
| Si | = | relative weight percentage (spectral) sensitivity of the i-th element |
The normalization factor, F, is a calibration factor determined at each depth from a closure argument to account for the number of neutrons captured by a specific concentration of rock elements. Because the sum of oxides in a rock is 100%, F is given by
F (Sum(Xi Yi / Si)) + XK WK + XAl WAl = 100
where
| Xi | = | factor for the element to oxide (or carbonate) conversion |
| XK | = | factor for the conversion of K to K2O (1.205) |
| XAl | = | factor for the conversion of Al to Al2O3 (1.899) |
| WK | = | dry weight percentage of K determined from natural activity |
| WAl | = | dry weight percentage of Al determined from the activation measurement |
The sensitivity factor, Si, is a tool constant measured in the laboratory, which depends on the capture cross-section, gamma-ray production, and detection probabilities of each element measured by the GST (Hertzog et al., 1989).
The factors Xi are simply element to oxide (or carbonate, sulfate) conversion coefficients and effectively include the O, C or S bound with each element. In processing the GLT data the correct choice of Xi is important in the closure algorithm described above and requires geological input. In most lithologies the elements measured by the tool occur in silicates where the compositions can be expressed completely as oxides.
Step 6: Calculation of oxide percentages
This routine converts the elemental weight percentages into oxide percentages by multiplying each by its associated oxide factor (Table 1).
The oxide weight percentages are loaded in the file 735B-oxides.dat.
Table 1. Oxide/carbonate factors used in normalizing elements to 100% and converting elements to oxides/carbonates.
| Element | Oxide/carbonate | Conversion factor |
| Si | SiO2 | 2.139 |
| Ca | CaO | 1.339 |
| Fe | FeO* | 1.358 |
| K | K2O | 1.205 |
| Ti | TiO2 | 1.668 |
| Al | Al2O3 | 1.889 |
| Mg | MgO | 1.658 |
References
Grau, J. and Schweitzer, J.S. (1989). Elemental concentrations from thermal neutron capture gamma-ray spectra in geological formations. Nuclear Geophysics 3(1): 1-9.
Hertzog, R., Colson, L., Seeman, B., O'Brien M., Scott, H., McKeon, D., Grau, J., Ellis, D., Schweitzer, J., and Herron, M. (1989). Geochemical logging with spectrometry tools. SPE Formation Evaluation, 4(2): 153-162.
Lock, G. A. and Hoyer, W. A. (1971). Natural gamma-ray spectral logging. The Log Analyst, 12(5): 3-9.
Ruckebusch, G. (1983). A Kalman filtering approach to natural gamma-ray spectroscopy in well logging. IEEE Trans., Autom. Control, AC-28: 372-380.
Scott, H. D. and Smith, M. P. (1973). The aluminum activation log. The Log Analyst, 14(5): 3-12.
For any question about the data or about the LogDB database, please contact LogDB support: logdb@ldeo.columbia.edu.