Multi-Sensor Spectral Gamma Ray (MGT) Data Processing
ODP logging contractor: LDEO-BRG
Hole: 1257A
Leg: 207
Location: Demerara Rise (equatorial NW Atlantic)
Latitude: 9° 27.230' N
Longitude: 54° 20.518' W
Logging date: January 18-19, 2003
Bottom felt: 2962 mbrf (used for depth shift to sea floor)
Total penetration: 284.7 mbsf
Total core recovered: 216.05 m (75.89%)
MGT depth range: 72.5-259 mbsf (Pass 1), 72.5-255 mbsf (Pass 2)
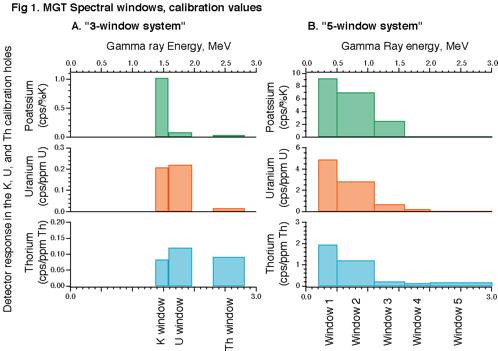
The Multi-Sensor Spectral Gamma Ray Tool (MGT) measures the natural gamma radiation emitted by a formation using an array of four short detector modules with approximately 2-ft spacing. The tool is designed to provide spectral gamma ray data at a better vertical resolution (by a factor of 2-3) than the Schlumberger gamma ray tools in use in ODP. Each module comprises a small 2" x 4" NaI detector, a 256-channel spectral analyzer, and an 241Am calibration source. The spectral counts are taken 4 times per second and assigned to 8 energy windows (Figure 1) before being transmitted up the wireline cable to the data acquisition unit on the drill ship (Goldberg et al., 2004).
The purpose of this report is to describe the data from Hole 1257A and the processing steps used to output the total gamma radiation, and the potassium, uranium, and thorium concentrations.
MGT Processing
1. The original data file is manually edited to remove occasional anomalous values (for example, values orders of magnitude greater than the typical counts in the 0.25 second counting window of 0-100). The total gamma ray values output directly by the MGT are in API units, based on a calibration of 0.952 cps/API.
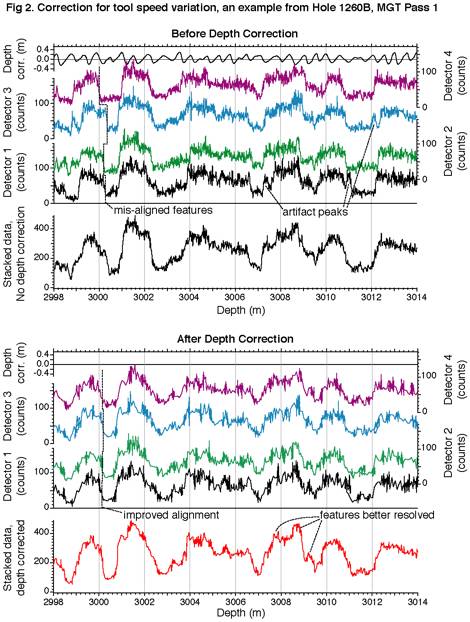
2. Depth correction and stacking. In order to stack the data from the four detectors, short-term variations in tool speed must be accounted for. The acceleration data, measured by an accelerometer in the MGT, is integrated twice to produce a depth correction, which is applied to the depth index of the logs. This results in better alignment of features and the elimination of artifact peaks in the logs from the individual detectors, and consequently, a better vertical resolution in the stack. Under moderate ship heave conditions, the correction reaches a maximum of approximately +/- 0.3 m (see Figure 2 for an example from Hole 1260B).
The detector data are then stacked over a 20-cm interval, and output with a 5-cm-spacing. This smoothing interval was chosen as a trade-off to achieve noise reduction while maintaining a high depth-resolution. An in-house Labview program called MGT-resampler is used for this step.
3. The depth reference is shifted from below rig-floor (mbrf) to below sea-floor (mbsf), based on the sea-floor depth determined from the Schlumberger gamma ray logs.
4. The potassium, uranium, and thorium logs are recalculated based on calibrations made in test holes with known K, U, and Th concentrations, by the method described by Mathis, 1984. Briefly,
C = AX
where C is 3 x 1 matrix of the measured gamma ray counts in the K, U, and Th energy windows; A is the 3 x 3 matrix of calibration values (Figure 1A); and X is the 3 x 1 matrix of the concentration of K, U, and Th in the formation.
The equation is solved for X by multiplying C by the inverse of the calibration matrix.
Prior to the calculation, the window data is smoothed with a cosine window of half-width 0.5 m, in order to smooth out some of the noise in the counts. The total gamma ray is not smoothed at this stage. This calculation can result in negative values where the gamma ray counts are low.
5. The MGT data are depth-matched to the depth reference log (usually the HSGR gamma ray log from the HNGS tool) in the Schlumberger Geoframe log analysis software. The match to the HNGS logs in depth and amplitude provides a data quality check.
6. The MGT data are output as tab-delimited ascii files with log names:
GR_MGT total gamma ray (API units)
POTA_M1 Potassium (%)
URAN_M1 Uranium (ppm)
THOR_M1 Thorium (ppm)
General MGT Data Quality
The data quality of the MGT total gamma ray log is very good, matching the amplitude and shape of the HSGR log well, with better vertical resolution. The average value for most of the log is around 45 API units. The black shale interval between 175-220 mbsf is more radiogenic, with peaks as high as 150 API units, as a result of the association of uranium with organic matter in the shale. Potassium and thorium concentrations are decrease in this interval. Some noise is present in the data, particularly where the counts are low.
The quality of the MGT data depends principally on the number of gamma ray counts recorded by the detectors in the various energy windows. Therefore, the total gamma ray has a better quality (better statistical significance and less noise) than the K, U, and Th logs, because it includes gamma ray counts from the whole energy range (0.2-3.0 MeV), whereas the K, U, and Th logs are calculated from gamma ray energies >1.37 MeV. All the logs are less noisy when the formation is more radiogenic and the counts are higher. The thorium log tends to have lower values than the equivalent thorium log from the Schlumberger HNGS tool.
Future improvements in the MGT data processing may include dynamic smoothing of the K, U, and Th logs, so that the smoothing window includes a constant number of counts. Also, recalculation of K, U, and Th may be carried out utilizing information from the five energy windows.
Borehole size correction (described in Goldberg et al, 2004) is not applied to the data, because the correction depends on whether the tool is centered in the hole or eccentered to the side of the hole, and this is not well known. Generally, the log values match the equivalent logs from the Schlumberger gamma ray tool well.
References:
Goldberg, D., Meltser, A., Myers, G., and Masterson, W., 2004 Proc ODP Sci. Repts. College Station, TX (Ocean Drilling Program). Vol. 191.
Mathis, G.L., Rutledge, D., and Ferguson, W., 1984. A Spectral Gamma Ray (SGRTM) Tool. SPWLA 25th Logging Symposium, Paper M.

The windows are chosen to encompass the main gamma ray emission lines at 1.46 (potassium), 1.76 (uranium), and 2.615 MeV (thorium). After emission, the gamma rays lose energy in the formation, hence a high number of gamma rays at lower energies are detected in Windows 1 and 2.

For any question about the data or about the LogDB database, please contact LogDB support: logdb@ldeo.columbia.edu.