 |
Figure 1: Location map of the sites drilled during ODP Leg 165 in the Caribbean Sea. |
Introduction
The two main objectives of the ODP Leg 165 in the Caribbean Sea were (1) the nature of the Cretaceous-Tertiary (K/T) boundary in a region close to the impact of the asteroid which seems to have fallen in Mexico (Yucatan) 65 Ma ago and (2) the influence of tropical seas circulation on global ocean history and climate evolution. Moreover, the recovered cores in Sites 998 to 1001 reveal a spectacular record of Eocene and Miocene explosive volcanism. Logging operations were undertaken at four (998 to 1001) of the five drill sites and the data were very useful on board to verify and expand upon observations made from cores. For example, FMS data allowed us to determine how much of the K/T boundary deposit was actually recovered. The logs also helped to identify exact depths of important seismic reflectors. All sites drilled during ODP Leg 165 are located in Figure 1.
|
Figure 1: Location map of the sites drilled during ODP Leg 165 in the Caribbean Sea. |
The standard logging tools were used during this leg: the Quad combination which includes the sonic, litho-density, resistivity tools, the geochemical tool and the Formation MicroScanner (FMS) which displays micro-resistivity images of the borehole wall. In addition, the Geological High-resolution Magnetic Tool (GHMT), which measures the total magnetic field and the magnetic susceptibility of the logged sediments, was also used. The natural gamma-ray tool was run on every toolstring to provide a reference for intercalibration.
The quality of the logging data acquired during Leg 165 was generally very good. The following table gives information on the logging operations performed.
| Hole 998B | Hole 999B | Hole 1000B | Hole 1001A | |
|---|---|---|---|---|
| Water Depth (mbsf) | 3179.8 | 2827.8 | 915.8 | 3259.6 |
| Depth Cored (mbsf) | 904.8 | 1066.4 | 695.9 | 522.8 |
| Interval Logged (mbsf) | ~904-172 | ~1060-550 | ~670-275 | ~470-82 |
| Toolstrings Deployed | Quad, GLT, FMS, GHMT | Quad, GLT, FMS | Quad, FMS, GHMT | Quad, FMS, GHMT |
Shipboard results
The K/T boundary has been drilled and logged at Sites 999 and 1001. The Formation Microscanner used across the boundary was very critical for determining on board the thickness of the in situ deposits linked to the K/T event and for evaluating the recovery of those sediments which are fragile and easily disturbed by drilling. The K/T boundary sequence at Site 999 consists of massive white limestone bounded by rich-clay layers and is clearly displayed on the FMS images as a distinct high resistivity band approximately 23 cm thick bounded by thin low resistivity layers. The core photo and the FMS image of the K/T boundary drilled and logged at site 1001 are presented in figure 3. Comparison of the FMS data and the recovered sediments indicates that 15-20 cm of the boundary deposit may not have been recovered.
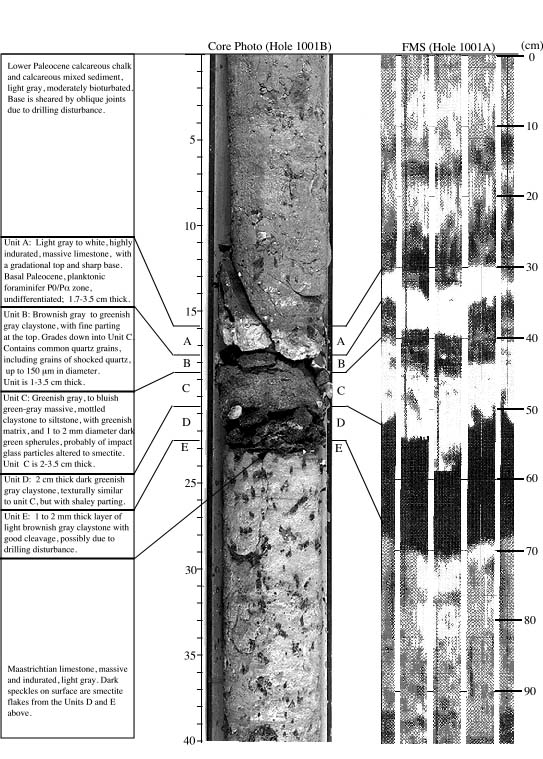 |
Figure 2: The Cretaceous/Tertiary boundary at Site 1001 on the lower Nicaraguan Rise. From left to right: lithostratigraphy description of the recovered boundary deposit, core photograph of the unsplit section corresponding to the K/T boundary, Formation MicroScanner downhole log of the K/T boundary interval. |
Numerous volcanic ash layers were recovered at each sites drilled during Leg 165 and are clearly detected in several logging data. They are representative of the mid- to latest Eocene and early to mid-Miocene explosive volcanism from the Central American arc. The presence of ash layers in the early to mid-Eocene at Site 998 on the Cayman Rise suggests local explosive volcanism of the Cayman Ridge. These ash layers appear on the FMS images as very dark layers, corresponding to very low resistive layers relative to the surrounding sediment. Thick ash layers are also responsible for distinct anomalies on various data. They generally correspond to maxima in the natural gamma-ray counts due to elevated concentrations in thorium, potassium and uranium, in the lithological indicator ratio (Si/(Si+Ca)), in the iron indicator ratio (Fe/(Si+Ca)) and in the porosity indicator ratio (H/(Si+Ca)). They also correspond to minima in velocity, density, resistivity and photo-electric effect values. As the FMS can detect very thin layers, the FMS data permit good estimates of the depth and thickness of ash layers where core recovery is often low.
Figure 3 presents an example of a zone where a large quantity of very dark ash layers was observed on cores at Site 999 which correspond to a distinct anomaly on some downhole logs.
 |
Figure 3: Response of some logging data (natural gamma-ray, sonic velocity, bulk density, resistivity, photo-electric effect, porosity indicator ratio) to the presence of ash layers in the drilled sediments of Site 999. The underlined zone between 790 and 795 mbsf corresponds to the presence of a lot of thin ash layers observed on the drilled cores. |
One of the objectives of Leg 165 is the paleoceanography of the Caribbean domain. The study of the cyclicity observed in the sediments permits the study of paleoclimatic variations. Because of the high-resolution and continuous record of the micro-conductivity recorded by the FMS tool, the spectral analysis of FMS data may allow us to determine the cyclicity recorded in the logged sediments, such as the Milankovitch cycles.
The aim of the GHMT is to determine the magnetostratigraphy of the sediments, combining the magnetic susceptibility and the total field recorded by the tool and studying the correlation of the obtained signals. The interpretation of the results should lead to a magnetostratigraphic sequence of the sediment crossed by the tools. These results will be compared to the paleomagnetic results obtained from measurements directly made on cores and should permit to have a continuous magnetostratigraphic sequence even where the core recovery is low.
Logging Scientist:
Dr Vèronique Louvel
Laboratoire de Mesures en Forage,
IMT, Marseille, France