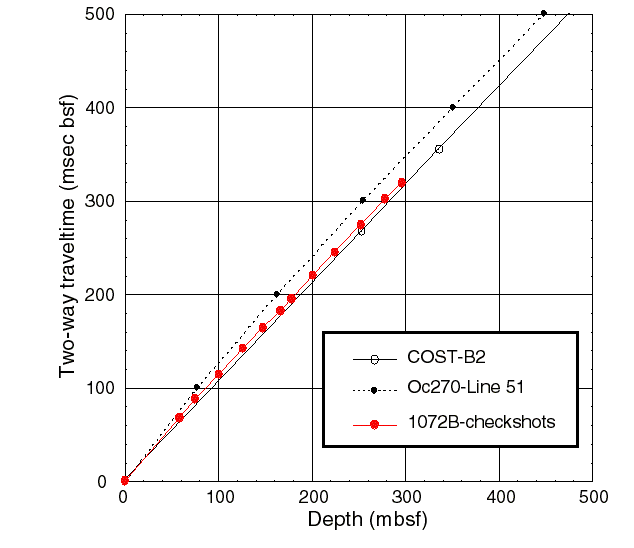

Similar interval velocities are seen at the COST-B2 and 1072B checkshot data, with the 1072B data providing a detailed velocity structure for the upper 300 meters of the sediment column. The stacking velocities derived from Oc270-Line51 near Site 1072 are significantly slower, and predict depths as much as 20 m deeper for reflections seen at ~0.3 s two-way time below the seafloor. The check-shot data provides an accurate time conversion at this site for correlation of logs/cores to the seismic reflection profiles.