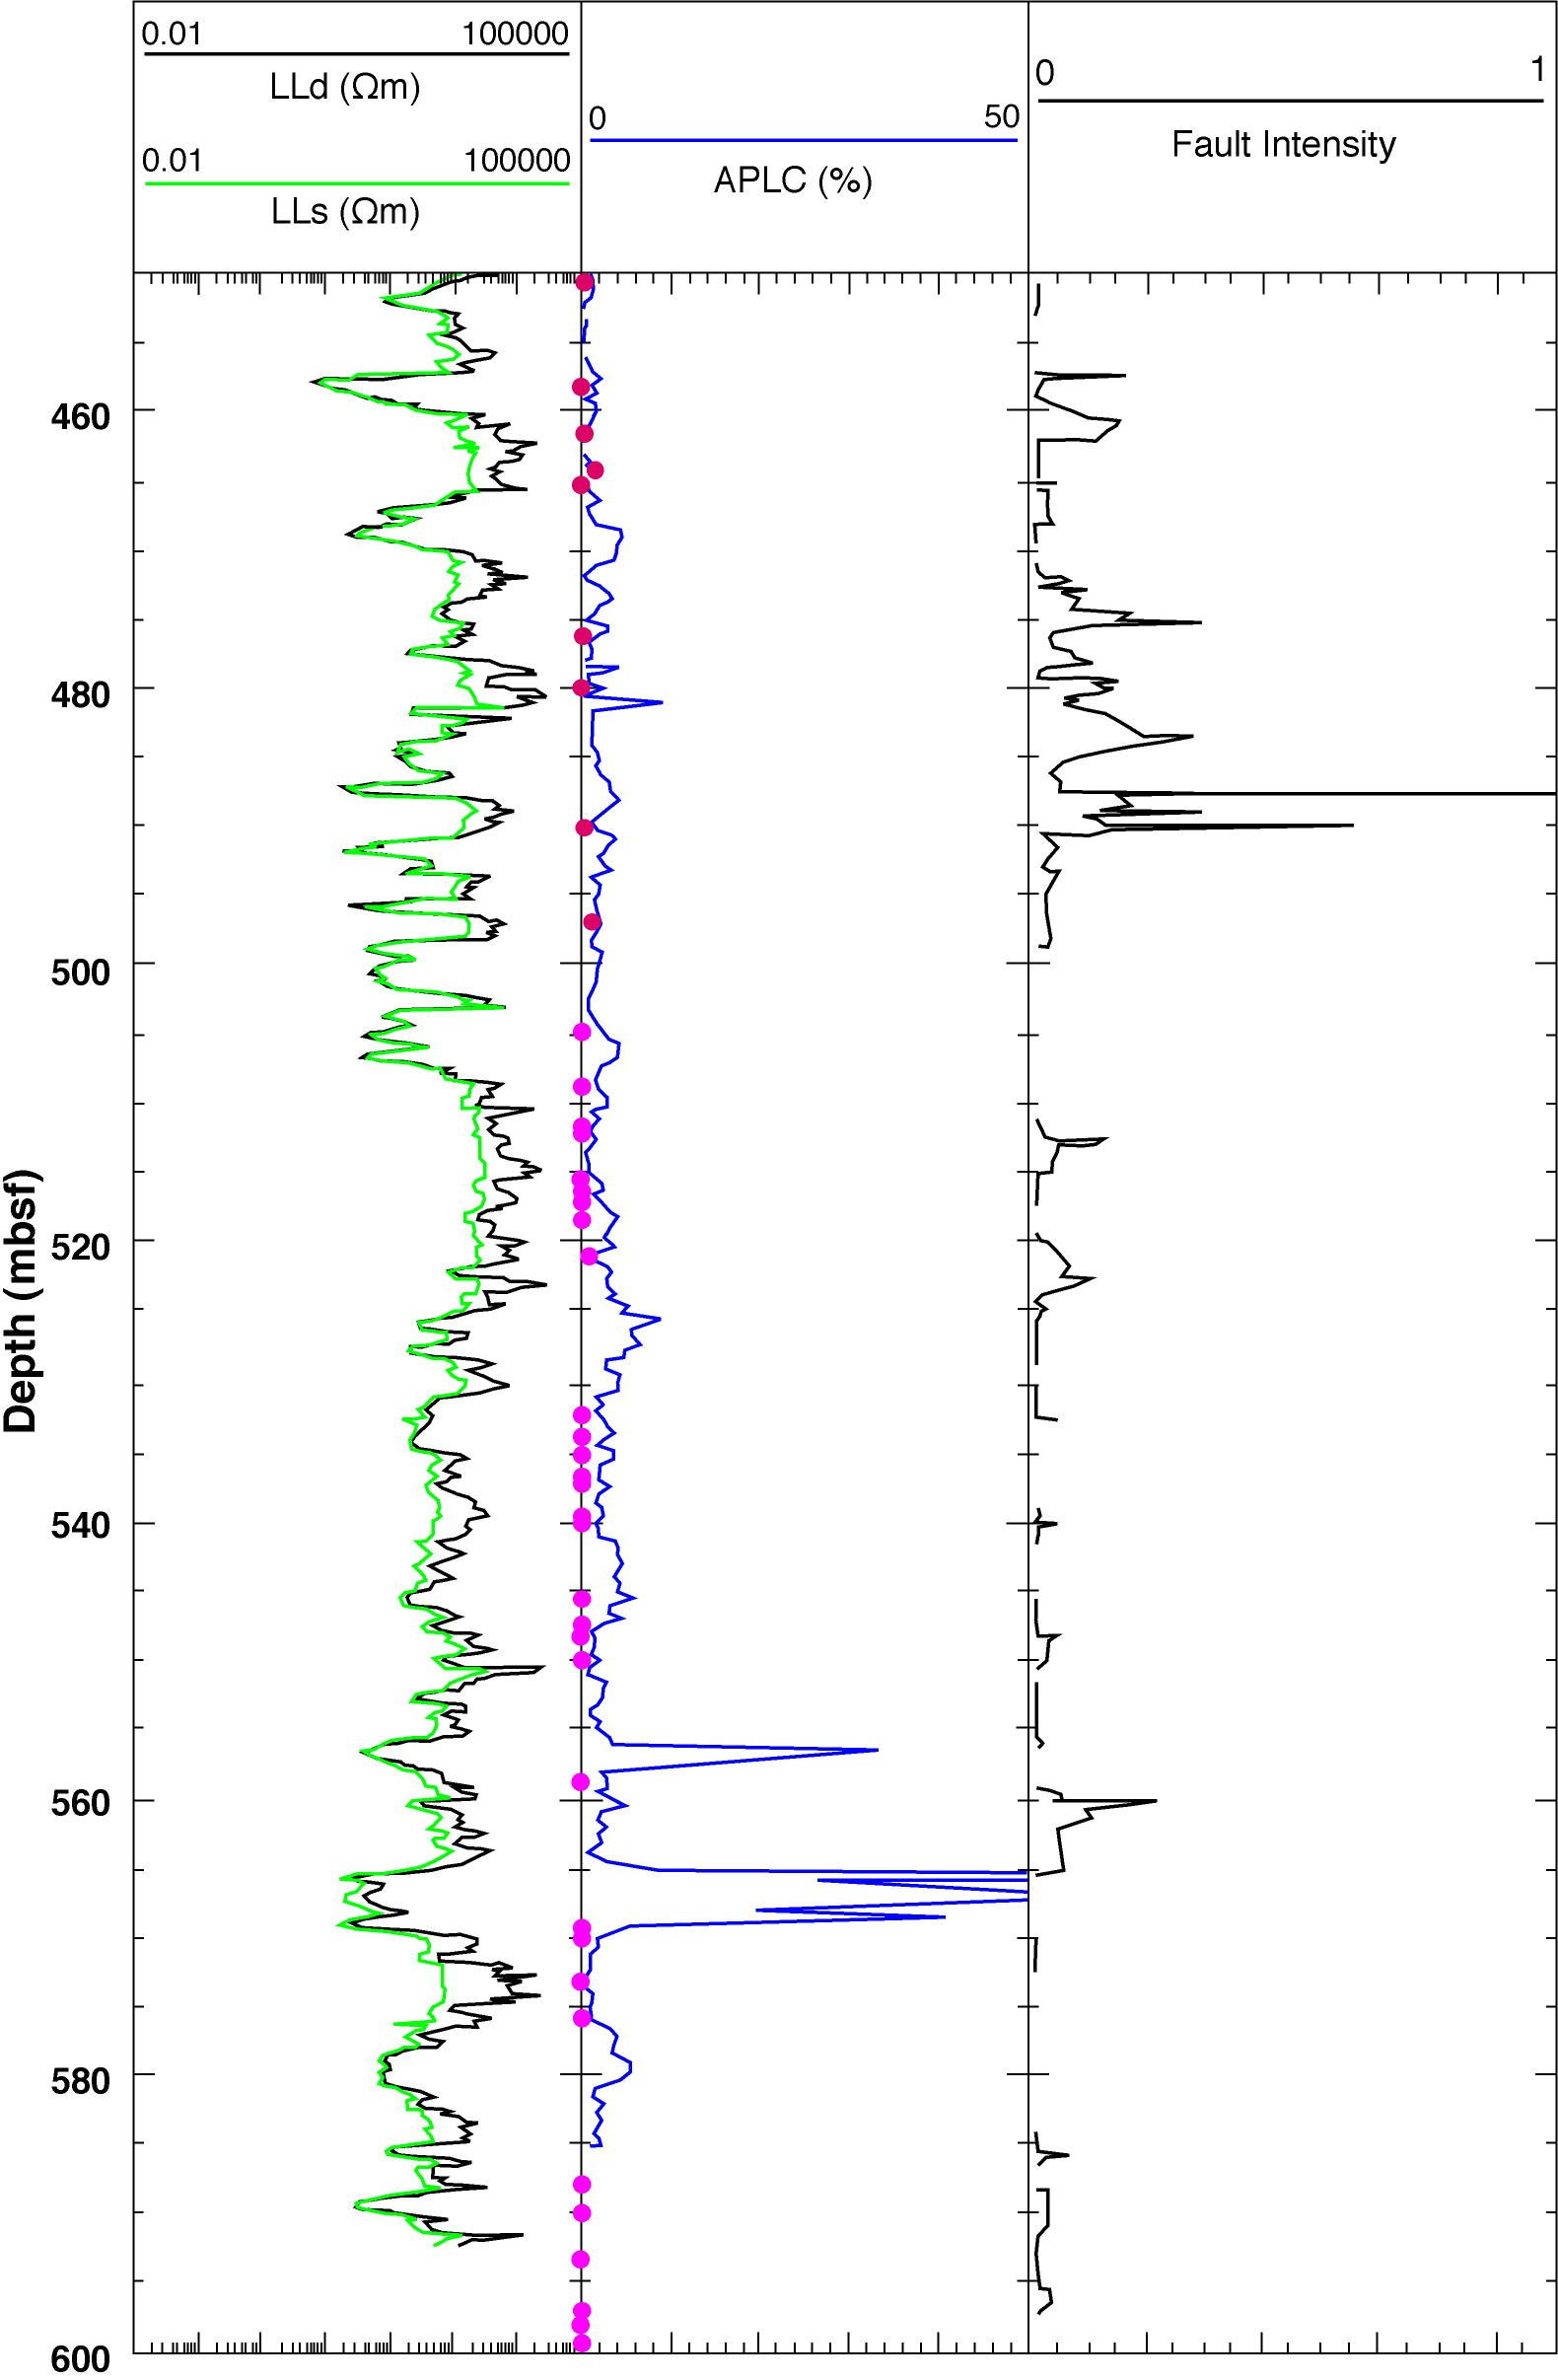

Plot showing deep (LLd) and shallow (LLs) resistivity logs in track 1; array epithermal porosity (APLC) log and Legs 118 and 176 discrete laboratory porosity measurements in track 2; and fault intensity measurements from core observations in track 3.