ODP Leg 176: Return to Hole 735B
Figure 12
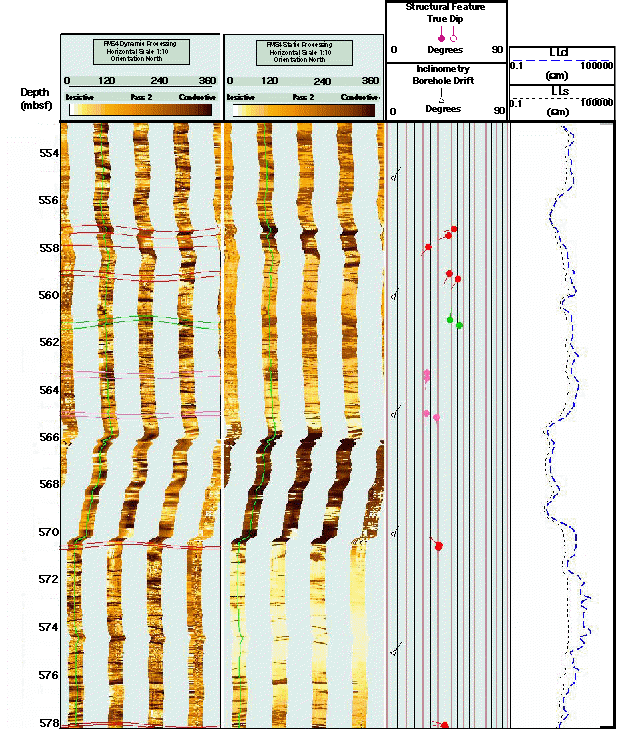
FMS image showing a 25 m interval that includes several structural features which correlate with high core fault intensity measurements.


This figure also includes a depth scale in mbsf; dynamic and static processed FMS images; borehole drift and structural dips and azimuth; deep and shallow resistivity logs from the DLL.