ODP Leg 196: Deformation and Fluid Flow Processes in the Nankai Trough Accretionary Prism
Figure 7.
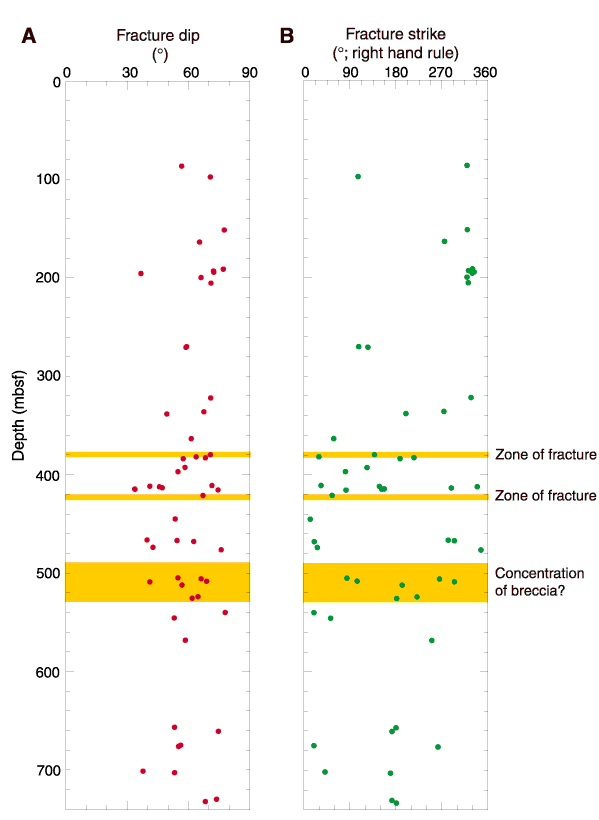
(A.) RAB image of fractures at ~410 mbsf (Hole 1173B) cutting subhorizontal stratigraphy. Figure shows uninterpreted RAB image (left), interpreted RAB image (center), and fracture dip and orientation data (right). The fractured zone is generally more resistive than overlying and underlying sediments. The fracture at 415 mbsf (indicated by arrow) displaces a subhorizontal conductive (dark) bed with normal offset. (B.) RAB image of fracture at 321 mbsf cutting subhorizontal high-resistivity ash layer. Resolution of original RAB image data far exceeds output resolution shown here. Images processed with equalized histogram over the entire hole (static normalization).
