ODP Leg 208: Early Cenozoic Extreme Climates: the Walvis Ridge Transect
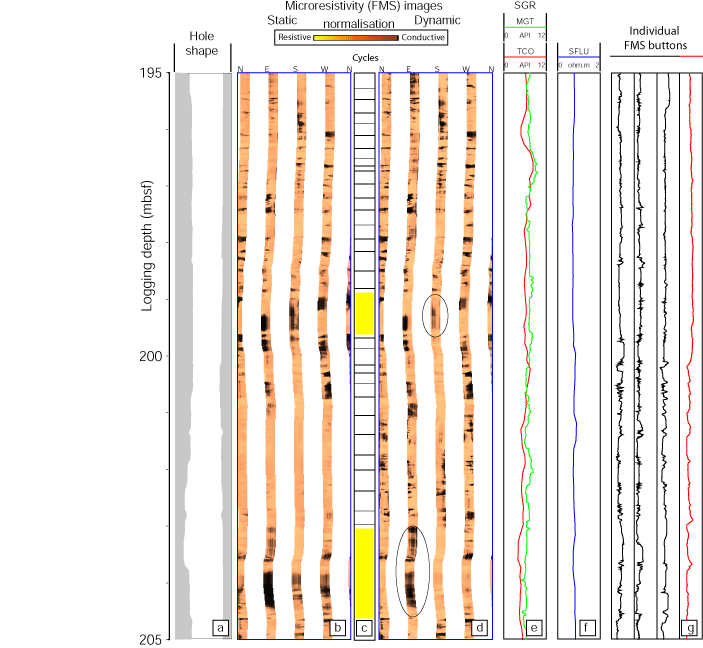
Figure 13
Formation Microscanner images from Hole 1265A and cycles between 195 and 205 mbsf. (a) hole shape, (b) static and (d) dynamic (window height = 0.5 m) normalization of the microresistivity images, (c) cycles, (e) gamma-ray and (f) surface resistivity logs. (g) extracted FMS button records showing the weak amplitude of the resistivity measurement and the poor pad-formation contact (red). Yellow rectangles underline zones where stick-slip displacements have occurred and impair image quality.
