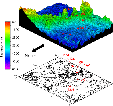
Figure 1. Location map of the Walvis Ridge transect and Leg 208 drilled sites. Logged sites are Site 1263 and Site 1265.
Downhole Logging Summary
During Ocean Drilling Program (ODP) Leg 208, six sites between 2500 and 4800 m water depth targeting early Cenozoic sediments on the northeastern flank of Walvis Ridge have been drilled (Figure 1).
Figure 1. Location map of the Walvis Ridge transect and Leg 208 drilled sites. Logged sites are Site 1263 and Site 1265.
Drilling objective was to recover fully intact sequences spanning both the Paleocene/Eocene and Eocene/Oligocene boundaries as well as the Cretaceous/Tertiary boundary at the deep end-member sites. Composite sections of the sedimentary sections provide a detailed history of paleoceanographic variations associated with several prominent episodes of early Cenozoic climate change including the Early Eocene Climate Optimum (EECO), the Paleocene-Eocene Thermal Maximum (PETM, also know as LPTM), and the Early Oligocene Glacial Maximum (EOGM) (Figure 2). The major objectives of Leg 208 consist to characterize the depth-dependent changes in deep water chemistry and circulation associated with these extreme climatic states. This will facilitate testing of leading hypothesis for the cause of the PETM and carbon isotope excursion, the abrupt dissociation of as much as 2000 gigatons of marine methane hydrate. The Leg 208 transect complement a transect drilled on the southern Shatsky Rise during ODP Leg 198.
Because logging measurements are at an intermediate scale between cores and geophysical surveys, core-log / log seismic integration provide a unique method for extending hole results to a regional scale (Figure 3).
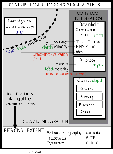
Figure 3. Schema displaying logging contribution. (1) core-log integration: logs provide true depth to adjust core-derived measured composite depth (mcd), and (2) log-seismic integration allowing identification and dating of seismic reflectors.
The main contribution of acquisition of in situ, continuous multi-parameter logging data are:
(1) assess the physical, chemical and structural characteristics of the formation, and to provide the baseline for depth matching the core-derived composite depth (mcd) scale.
(2) perform cyclostratigraphic analysis of continuous Paleogene sequences.
(3) identify and characterize chert layers which are poorly recovered in cores.
(4) conduct a seismic integration (time/depth model and synthetic seismogram) allowing identification and dating of seismic reflectors at a regional scale.
Three logging runs including the Triple Combination configuration, Formation Micro Scanner (FMS)-Sonic configuration and vertical seismic profiling using the WST-3 were planned for Holes 1263A and 1265A. The logging program has been completed only at Hole 1265A as a blockage at 174 mbsf during the first FMS-sonic run and identification of a progressive hole collapse prevented further tool penetration in Hole 1263A (Figure 4).

Figure 4. Summary of the logging operations undertaken at Holes 1263A and 1265A.
However, the achieved logging data are generally of high quality (Figures 5 and 6) and of great use for the leg objectives.
Figure 5. Quality control and depth match of the Triple Combo (data in red) and FMS-sonic toolstrings (data in blue) at Hole 1263A. Triple Combo: (a) Caliper, (b) normalized vertical tool acceleration (NAz) and (c) Wavelet depth-scale representation of NAz between 130 and 280 mbsf. The analyzed record (133-277 mbsf) is characterized by acceleration/deceleration mainly over a range < 1 m. Major washouts are characterized by localized stick-slip displacement over intervals of intermediate scale (~ 4-7 m). The high frequency component could be explained by incomplete heave compensation, the other components are related to hole condition (size of the washout). The comparison of the wavelet representation and hole shape shows that the intervals where tool acceleration changes correspond to changes in hole diameter. FMS-sonic: (d) Calipers, (e) normalized vertical acceleration (NAz). As for the Triple combo, acceleration of the FMS-sonic toolstring remained at low levels. Close-up of interval 110 and 150 mbsf: (f) FMS-sonic caliper and (g) computed gamma ray (CGR) logs from Hole 1263A. No unambiguous depth match between the runs could be found. Therefore, the same shift to seafloor was applied to the FMS-sonic logs. Note the discrepancy between the Triple Combo and the FMS caliper data.
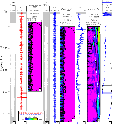
Figure 6. Quality control of the Triple Combo (in red) and FMS-sonic (in blue) acceleration at Hole 1265A. Triple Combo: (a) Caliper, (b) normalized vertical tool acceleration (NAz) and (c) Wavelets depth-scale representation of NAz between 90 and 250 mbsf. The wavelet analysis of the acceleration data allows the multi-scale components of the tool acceleration to be deciphered. The analyzed record (90-250 mbsf) is characterized by acceleration/deceleration mainly over a range < 0.6 m, testifying of almost perfect heave compensation during this run. No intervals of intermediate scale (approximately 4 to 7 m) usually attributed to localized stick-slip displacement over washout are detected. FMS-sonic: (d) Calipers, (e) normalized vertical acceleration (NAz) and (f) depth-scale representation of NAz between 100 and 320 mbsf. The acceleration of the FMS-sonic toolstring remained at levels characteristic of no stick-slip displacement (g) Horizontal acceleration (Ah) and (h) its depth-scale representation. The depth-scale representation is characterized by a progressive decrease in rotation wavelength/smoothness uphole, going from more than 20 m in the upper part of the hole, to 8 m in the middle interval with washouts (170 mbsf - 210 mbsf), to 3 m above. Moreover, the interval above 138 mbsf shows a higher horizontal acceleration as only one axis of the FMS is in contact with the formation. Above 240 mbsf, localized and rapid variations in horizontal acceleration are rare and of low amplitude, and do not impair data quality. As a result, the tool orientation is smoothly guided by the change in hole azimuth (i), and the quality of the microresistivity images is good in the bottom part of the hole and progressively degrade uphole. (i) Hole azimuth (Hazi) and orientation (p1AZ) of the FMS-sonic toolstring. Note the discrepancy between the Triple Combo and the FMS caliper data.
The logged sections are characterized by very subtle variations around very low mean values (Figures 7 and 8).
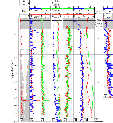
Figure 7. Log stratigraphy at Hole 1263A. (a) Hole shape and computed gamma ray (CGR), (b) total gamma ray (SGR) and uranium contribution (URA), (c) potassium (FK) and thorium (THO) contributions to natural radioactivity, (d) deep (IDPH), intermediate (IMPH) and shallow (SFLU) resistivities, (e) porosity (APLC) and capture cross-section (SIGF), (f) formation density (RHOM) and photoelectric factor (PEF), (g) Transient temperature down-log and up-log (h) log sub-units, and(i) rescaling of the total gamma ray (SGR) and shallow resistivity (SFLU) logs between 80 and 280 mbsf to better underline the limit between log subunit1a and log subunit1b.
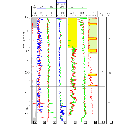
Figure 8. Log stratigraphy at Hole 1265A. (a) Hole shape and computed gamma ray (CGR), (b) total gamma ray (SGR) and uranium contribution (URA), (c) potassium (FK) and thorium (THO) contributions to natural radioactivity, (d) deep (IDPH), intermediate (IMPH) and shallow (SFLU) resistivities, (e) porosity (APLC) and capture cross-section (SIGF), (f) formation density (RHOM) and photoelectric factor (PEF), (g) downhole compressional velocities (VP), (h) log sub-units
For example, total gamma ray does not exceed 33 API and is mostly below 6 API. As total radioactivity is low, the absolute abundance of each element (uranium: URA, thorium: THO and potassium: FK) is also low. The resistivities (surface: SFLU, mean: IMPH and deep: IDPH) are commonly plotted in a logarithmic scale due to the range of order of magnitude cover by this measurement. Here, resistivities are comprised between 0.3 and 2.2 ohm.m and are plotted in a linear scale. Highest variabilities are recorded in porosity (APLC) and density (RHOM) logs and their associated parameters, namely the capture cross-section (SIGF) and the photoelectric factor (PEF). Based on (i) the homogeneity of the formation and (ii) the previous general description of the formation, one log unit containing different sub-units have been defined at these sites (Figures 7 and 8). These sub-units have been differentiated using mainly the density and porosity logs and in addition the resistivity logs and the velocity log when available (1265A).
With respect to the Leg Objectives (see above) the results are as follows:
(1) to assess the physical, chemical and structural characteristics of the formation, and to provide the baseline for depth matching the core-derived composite depth (mcd) scale. The core-derived measured composite depth (mcd) can be accurately adjusted to the true depth (Figure 9).
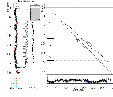
Figure 9. Precise mapping of composite section to logging equivalent depth at Site 1265. 41 tie-points have been picked in between 71.45 mbsf and 292 mbsf logging depth, and constitute the basis for locally adjusted compression ratio. Above (pipe) and below (poor core recovery) this interval, no correlation is possible by lack of data, and a linear extrapolation was used. As a result, the mean compression ratio (~15%) is in very good agreement with the core-derived composite depth growth rate. Lower part of log subunit 1a and log subunit 1b (mean density 1,9 g/cm3 almost constant within this interval) is characterized by a lower expansion rate.
Formation properties correlated well with the lithostratigraphy and excellent pattern matching between the core and the log data was achieved (Figures 10 and 11).
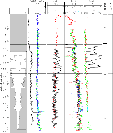
Figure 10a. Core-log integration at Site 1263. Hole shape, gamma-ray, porosity, density, velocity and lithostratigraphy and log sub-units.
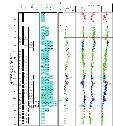
Figure 10b. Core recovery, lithology, lithological units and magnetic susceptibility and color reflectance data vs. equivalent logging depth (mbsf).
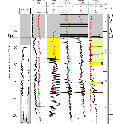
Figure 11a. Core-log integration at Site 1265. Hole shape, gamma-ray, porosity, density, velocity and lithostratigraphy and log sub-units.
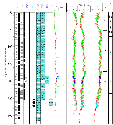
Figure 11b. Core recovery, lithology, magnetic susceptibility and color reflectance data, lithological and log units vs. equivalent logging depth (mbsf).
(2) to perform cyclostratigraphic analysis of continuous Paleogene sequences. Over the logged portion of the holes, all standard logs display pervasive cyclicity at a number of depth-scales (~ 3 - 25 m, Figure 12).
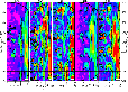
Figure 12. Wavelet Transform (modulus) of density (RHOM), porosity (APLC), total gamma ray (HSGR), medium resistivity (IMPH) and surface resistivity (SFLU) between 110 and 270 mbsf at Hole 1263A. Vertical axis: logging depth (linear scale, mbsf); horizontal axis: scale (log2 scale, m). Red: high modulus, blue: low modulus. Thin solid lines indicate interval of statistically significant modulus. Thick solid line indicates zone where edge effects become important. Thin dashed lines mark the main cycles around 4, 11, 15 and 25 m. The density (RHOM), anti-correlated with the porosity (APLC), shows much smaller fluctuations than the cycles about 30 m, 15 m and 10 m. The porosity (APLC) and the gamma ray (HSGR) logs both show cyclicity down to the sub-meter scale. Resistivity (medium: IMPH and shallow; SFLU) cycles are similar to density cycles, but with a greater detail. The changes in the spatial distribution of these localized cycles conform with, and thus reinforce the previously defined unit sub-division (note the change in the pattern of the Wavelet Transform representation around 170 mbsf).
A number of high-resolution data sets were recorded including gamma ray measurements from the Lamont Doherty Multi-Sensor Gamma Ray Tool (MGT). The Formation MicroScanner (FMS) micro-resistivity data imagery identified cycles operating at the sub-meter level providing a data set readily amenable to time series analysis (Figures 13, 14 and 15).
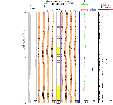
Figure 13. Formation Microscanner images from Hole 1265A and cycles between 195 and 205 mbsf. (a) hole shape, (b) static and (d) dynamic (window height = 0.5 m) normalization of the microresistivity images, (c) cycles, (e) gamma-ray and (f) surface resistivity logs. (g) extracted FMS button records showing the weak amplitude of the resistivity measurement and the poor pad-formation contact (red). Yellow rectangles underline zones where stick-slip displacements have occurred and impair image quality.
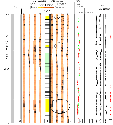
Figure 14. Formation Microscanner images from Hole 1265A and cycles between 205 and 215 mbsf. Green rectangle underline zone where stick-slip displacements have occurred but have been partly corrected by post-processing
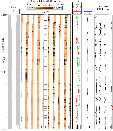
Figure 15. Formation Microscanner images from Hole 1265A and cycles between 245 and 255 mbsf.
(3) to identify and characterize chert layers which are poorly recovered in cores. The good quality microresistivity imagery obtained in the bottom part of Hole 1265A with the FMS tool provided clear information on the location and characteristics of the chert layers (Figures 16 and 17).
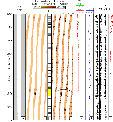
Figure 16. Formation Microscanner images from Hole 1265A and chert layers between 280 and 320 mbsf.
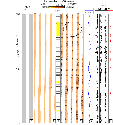
Figure 17. Formation Microscanner images chert layer from Hole 1265A. Zoom in between 295 and 305 mbsf of the figure 17.
(4) to conduct a seismic integration (time/depth model and synthetic seismogram) allowing identification and dating of seismic reflectors at a regional scale. As a preliminary step in the comparison between log and core properties, Figures 18 and 19 show the relationship between (a) velocity and density measured on core, (b) downhole densities vs. core densities, and (c) downhole densities vs. core velocity at Sites 1263 and 1265, all data relative to the equivalent logging depth. All the previous relationships show a linear increase in density and velocity with depth.
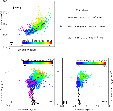
Figure 18. Seismic modeling inputs from Hole 1263A. (a) whole core velocities vs. whole core densities, (b) downhole densities vs. whole core densities and (c) downhole densities vs. whole core velocities relationships in function of the equivalent logging depth (mbsf).
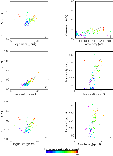
Figure 19. Seismic modeling inputs. (a) core densities vs. downhole densities, (b) core velocities vs. downhole velocities, (c) core velocities vs. core densities, (d) downhole velocities vs. downhole densities, (e) core densities vs. downhole densities and (f) downhole velocities vs. core densities relationships in function of the equivalent logging depth (mbsf).
This trend in velocity is corroborated by the check-shot survey conducted in Hole 1265A (Figure 20).
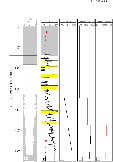
Figure 20. Sonic data from Hole 1265A. (a) hole shape, (b) core and downhole sonic data, (c) one-way travel time, (d) mean interval velocity, and (e) mean interval density
Assuming the velocity of the sea water equal to 1525 m/s and according to the lowermost check-shot, the mean velocity of the formation is1650 m/s, a typical value for soft sediment. The Paleocene/Eocene (PE) boundary recovered in Hole 1265A at 275 mbsf (logging equivalent depth) is associated with a reflector identified on the seismic line Geob048 (common depth point 3850) at ~4385 ms two-way travel-time (2192.5 ms one-way travel-time, see Figure 21) which is in excellent agreement with the travel time from the check-shots number 3 and 4 at 265 and 285 mbsf, respectively (Table 1).
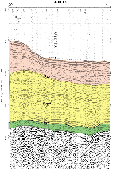
Figure 21. Seismic line geob048 and identified seismic reflectors at Site 1265.
|
Stack number
|
Measured depth (m)
|
Depth (mbsf)
|
Measured 1W-TT (ms)
|
Corrected 1W-TT (ms)
|
Interval velocity (m/s)
|
|
6
|
3250
|
175
|
2145.49
|
2146.49
|
1984.55
|
|
5
|
3315
|
240
|
2178.23
|
2179.24
|
2210.64
|
|
4
|
3340
|
265
|
2189.54
|
2190.55
|
2197.94
|
|
3
|
3360
|
285
|
2198.63
|
2199.65
|
2308.14
|
|
2
|
3380
|
305
|
2207.30
|
2208.31
|
2142.52
|
|
1
|
3395
|
320
|
2214.30
|
22153.32
|
-
|
Table 1. 1265-H-3: Check-shot survey
In the lower part of the borehole (170 to 320 mbsf) where check-shot measurements are available every 15 - 25 m, interval velocities are between 1980 and 2300 m/s. These values are consistent with the in-situ velocity measured by the Dipole Sonic Imager (DSI) in that section, except for a few short intervals where the P-wave labeling algorithm in the Schlumberger software had difficulty in identifying the P-wave of the formation (Figure 22).
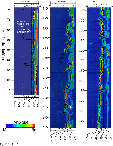
Figure 22. Stacked sonic waveforms. Examples of the problem encountered by the P-wave labelling algorithm, in 'slow' sediments, where the formation velocity approaches those of the drilling mud (left and center) and good picking in more consolidated formation (right). The black solid lines represent the results of the wave labeling algorithm.
The mean interval velocity of the lower 145 m of the borehole (~ 2100 m/s) from the check shots exceeds by more than 30% the velocity values measured on cores. Low values of the core can be explained by their decompression and/or fabric modification when measured onboard.
Interval velocities deduced from the check-shot survey result from a clear picking of arrival times of the P-wave at the Well-Seismic Tool (WST) geophones, and high confidence can be attributed to these measurements. Indeed, they concord with (i) the sea floor time and (i) the PE reflector identified of the Geob48 seismic line. However, having a mean formation velocity equal to ~1650 m/s and high velocity of ~2100 m/s in the lower part of the formation implies that the upper part (0 - 170 mbsf) has an interval velocity <1400 m/s. This value is not realistic, as it is lower than sea-water velocity. No explanation has been found to explain this incoherence in the check-shot results.
Philippe Gaillot: Logging Staff Scientist, LGHF, ISTEEM, Université de Montpellier 2, Place Eugène Bataillon, CC056, F-34095 Montpellier Cedex 5, France.