Logging-While-Drilling adnVISION* Tool
Description
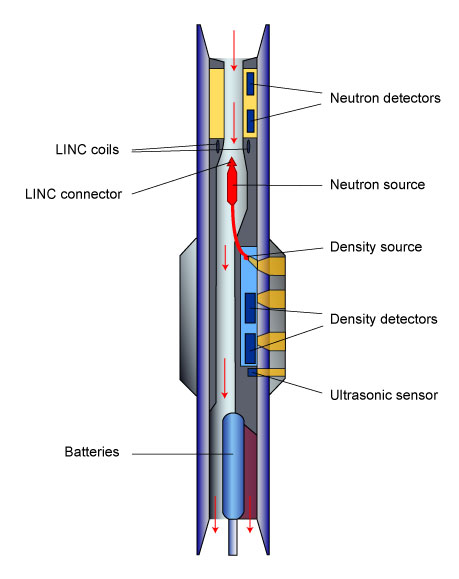 The Logging-While-Drilling-adnVISION (LWD-adnVISION) tool provides real-time apparent neutron porosity, formation bulk density and photoelectric factor data to characterize formation porosity and lithology while drilling. These nuclear measurements are borehole compensated for improved accuracy. 360-degree images of density and porosity result from the rotation of the tool’s sensors. Along with the azimuthal data, average values for each parameter are also available.
The adnVISION radioactive sources are safely contained in the drill collar and are connected to each other by a titanium cable that allows fishing by wireline through the drill pipe.
Applications
The adnVISION provides azimuthal borehole compensated formation density, neutron porosity and photoelectric factor measurements. Given present technological capabilities, estimations of bulk porosity and permeability are best made by in situ borehole measurements, preferably at scales large enough to average the effects of irregular fracture porosity and matrix porosity. LWD-adnVISION measurements allow for determining both matrix and fracture porosity and locating overpressure zones.
The adnVISION can be combined with the MWD-TeleScope, which measures parameters such as annulus pressure, torque, and penetration rates. Together, the MWD-TeleScope and adnVISION can render reliable measurements of effective pressure through both normal and overpressurized zones. If overpressurized zones exist within a fault zone, the magnitude and effects of fluid pressure on fault displacement and fluid flow can be assessed by estimating the amount of fluid expulsion (porosity reduction) in the immediate vicinity of the borehole.
Fault collapse and strain hardening, active fluid flow, fault-fluid interactions, and the formation of hydrofractures may occur within fault zones. Variations in fault displacement and fluid activity can be related to the in situ measurements to investigate the degree to which these processes are active. The adnVISION measurements of porosity and estimations of fluid pressure can illustrate the nature of the pressure seals as well as the physical processes responsible for fluid migration and redistribution along a fault zone or overpressure zones. The determination of the Vp and bulk modulus using LWD-sonicVISION and LWD-adnVISION data can also contribute to the understanding of the mechanical strength of the rocks within and near a fault zone. These LWD azimuthal measurements can be used to provide information regarding the spatial variation of physical properties around the borehole.
The adnVISION measurements can also provide porosity information as a function of borehole azimuth. To estimate strain from in situ porosity, lithological effects on these measurements must be first distinguished from the porosity effects. For this purpose, LWD-geoVISION resistivity and gamma ray measurements can be used to estimate any significant changes in clay mineralogy within a fault zone. Laboratory porosity measurements and thin sections of core samples allow observations of interstitial pore structures and can serve as a correlation tool for more refined calculations of continuous porosity records from the log data. The porosity and resistivity image data can provide information about fracture density, fracture aperture, and structural orientation in the vicinity of the hole. In addition, these data may be used to distinguish fractures that are transmissive from those that are not.
Environmental Effects
Laboratory measurements and mathematical modeling have been used to define the density and photoelectric response and to quantify environmental effects. These effects include gamma ray streaming, mud weight, tool standoff and photoelectric effects of formation and mud on density.
A reliable density measurement requires good contact between stabilizer and formation. Because a statistical caliper measurement is made during the recording, it is possible to check the quality of the contact. Contact also affects the neutron log response; the formation signal, particularly for the epithermal count rates, tends to be masked by the borehole signal with increasing hole size.
Log Presentation
Tool Specifications
| Temperature rating: | 300° F (150° C) |
| Pressure rating: | 25 kpsi (173 MPa) |
| Length: | 20.5 ft (6.3 m) |
| Weight: | 1,700 lbs (771.8 kg) |
| API nominal collar outside diameter: | 6.75 in (17.1 cm) |
| Maximum outside diameter: | 6.9 to 9.875 in (17.5 to 25 cm) |
| Flow range: | 0-800 gpm |
| Pressure drop coeffecient (C)*: | 135,000 |
| Maximum curvature – sliding: | 16 deg/100 ft (16 deg/31 m) |
| Maximum rotary torque: | 16,000 ft-lbf (4.877 m-lbf) |
| Minimum operating RPM: | 30 rpm |
| Uphole connection: | 5-1/2 FH box |
| Downhole connection: | 5-1/2 FH box |
| (*) pressure drop = [mudweight in ppg] x [flow in gpm]²/C |
Measurement Specifications
| Porosity | |
| Range: | 0-100 pu |
| Accuracy: | ±0.5 pu (<10 pu); 5% (10-50 pu) |
| Vertical resolution: | 12 in (30.48 cm) |
| Density | |
| Range: | 1-3.05 g/cm³ |
| Accuracy: | ±0.015 g/cm³ |
| Vertical resolution: | 6 in (15.24 cm) |
| Photoelectric effect | |
| Range: | 0-10 barns/e- |
| Accuracy: | ±5% barns/e- |
| Vertical resolution: | 2 in (5.08 cm) |
Major Outputs
| RHOB: | Bulk density (g/cm³) |
| DRHO: | Bulk density correction (g/cm³) |
| PEF: | Photoelectric factor (barns/e-) |
| TNPH: | Thermal neutron porosity (%) |
| DCAV: | Differential caliper (in) |
| NTCK: | Neutron detector sample depth tick mark |
| DTCK | Density detector sample depth tick mark |
| ROP5: | Rate of penetration, average over last 5 ft (m/hr) |
| NTAB: | Neutron time after bit (s) |
| DTAB: | Density time after bit (s) |
| RPM: | Rotational speed (rpm) |
* ®trademark of Schlumberger