Logging-While-Drilling – Compensated Density Neutron Tool (LWD-CDN*)
Description
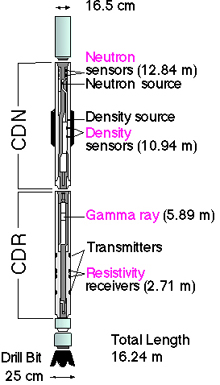 The physics of the measurements made by the LWD-CDN tool were similar to those of corresponding wireline services. For the neutron porosity measurement, fast neutrons were emitted from a 7.5-curie Americium-Beryllium (Am-Be) source. The quantities of hydrogen in the formation, in the form of water- or oil-filled porosity, primarily control the rate at which the neutrons slow down to epithermal and thermal energies. Neutrons were detected by near-and far-spacing detectors, and ratio processing was used for borehole compensation. The energy of the detected neutrons had an epithermal component because a high percentage of the incoming thermal neutron flux was absorbed as it passed through the 1-in. (2.5 cm) steel wall of the drill collar. Also, a wrap of cadmium under the detector banks shielded them from thermal neutrons arriving from the inner mud channel. This mainly epithermal detection practically eliminated adverse effects caused by thermal absorbers in the borehole or formation.
The density section of the tool used a 1.7-curie 137 Cesium gamma ray source in conjunction with two gain-stabilized scintillation detectors to provide a high-quality, borehole-compensated density measurement. The tool also measured the photoelectric effect for lithology identification.
The density source and detectors were positioned behind a full-gauge clamp-on stabilizer, which excluded mud from the path of the gamma rays, greatly reducing borehole effect. In deviated and horizontal wells, the stabilizer could be run under gauge for directional drilling purposes. Rotational processing provided an important correction in oval holes and yielded a differential caliper.
The CDN was used on several ODP legs from 1994 through 1997. It has been succeeded by the LWD-adnVISION.
Applications – Density Measurement
Porosity. If grain density is known, porosity can be calculated from the density log. Alternatively, porosity and density logs can together be used to calculate grain density.
Seismic impedance. The product of velocity and density can be utilized as input to synthetic seismogram computations.
Lithology and rock chemistry. In combination with the neutron log, the density log allows for the definition of the lithology and of lithologic boundaries. Because each element is characterized by a different photoelectric factor, this can be used, alone or in combination with other logs, to determine the lithologic type. Both density and photoelectric effect index are input parameters to some of the geochemical processing algorithms used onshore.
Applications – Neutron Porosity Measurement
Porosity. In reservoir engineering its importance is quite evident; in the study of the volcanic rocks that make up the upper oceanic crust, a good in-situ porosity measurement is most important to the correct understanding of the crustal structure. First, because it samples both the small-scale (microcrack, vesicle) porosity seen in the cores and large-scale fractures not sampled by drilling, and secondly because other properties such as density, seismic velocity, and permeability depend strictly on porosity variations and on the geometry of the pore space. In the presence of clays or hydrous alteration minerals a correction is required to account for the presence of bound water.
Lithology. Because the hydrogen measured by the tool is present not only as free water but also as bound water in clay minerals, the porosity curve, often combined
with the density log, can be used to detect shaly intervals, or minerals such as gypsum, which have a high hydrogen index due to its water of crystallization. Conversely, the neutron curve can be used to identify anhydrite and salt layers (which are both characterized by low neutron readings and by high and low bulk density readings, respectively).
Environmental Effects
A reliable density measurement requires good contact between stabilizer and formation. Because a statistical caliper measurement is made during the recording, it is possible to check the quality of the contact. Contact also affects the neutron log response; the formation signal, particularly for the epithermal count rates, tends to be masked by the borehole signal with increasing hole size.
Log Presentation
Bulk density, photoelectric effect, density correction, and caliper were usually displayed along with the neutron porosity curve and the gamma ray log. DRHO and DCAL were useful for quality control of the data; if the tool was operating correctly they should be less than 0.1 g/cc and 1 in., respectively.
Tool Specifications
| Temperature rating: | -13° to 300° F (-25° to 150° C) |
| Pressure rating: | 18 kpsi (124 MPa) |
| Length: | 30.6 ft (9.3 m) |
| Weight: | 2000 lbf (907 kg) |
| Maximum weight on bit : | F = 63,000,000/L² lbm (where L is the distance between stabilizers in feet) |
| Maximum flow rate: | 600 gal/min |
| Available collar sizes: | 6.75 in, 8.25 in (17.1 cm, 21 cm) |
| Availablestabilizers: | 8.50 in, 9.75 in (21.6 cm, 24.8 cm) |
Major Outputs
| DCAL: | Differential caliper (in) |
| DRHO: | Bulk density correction (g/cm3) |
| PEF: | Photoelectric effect (barns/e-) |
| ROMT: | Max. density total (g/cm3) from rotational processing |
| TNPH: | Thermal neutron porosity (%) |
| DTAB: | Density time after bit (hr) |
| NTAB: | Neutron time after bit (hr) |
* ®trademark of Schlumberger