Azimuthal Resistivity Imager (ARI*)
Description
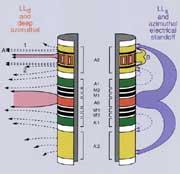
The Azimuthal Resistivity Imager (ARI) was a laterolog tool that made deep measurements and azimuthal resistivity images around the borehole. At the time it helped analyze features and details that escaped conventional resistivity measurements: thin beds (down to 8 in, 20 cm), borehole formation heterogeneity, formation dip, resistivity in dipping beds, and fracture position and orientation. The ARI produced images similar to the FMS with coarser vertical resolution, but complete azimuthal coverage. Whereas FMS electrodes are pad-mounted and in contact with the borehole surface, the ARI provided a remote image of the formation in a similar way to that of the BHTV.
The ARI electrode array operated simultaneously at two frequencies: 35 Hz for the deep readings and 280 Hz for shallow readings. It focused currents that flowed from the 12 electrodes to the grounded logging cable. The sum of these 12 readings produced a high-resolution measurement equivalent to a single laterolog electrode of the same height. To correct for tool eccentralization and variations in borehole shape, a shallow auxiliary measurement of electrical resistivities was performed at a much higher frequency of 71 kHz. This measurement responds primarily to the volume of borehole fluid affecting each electrode. If the borehole fluid resistivity is independently measured, then borehole size and shape can be deduced from the auxiliary array measurements. While the vertical resolution of the standard laterolog readings at the time was about 0.60 m, the high-resolution array could reduce this by up to a factor of 6, depending on the formation resistivity.
The ARI was deployed during ODP Leg 174B (Mid-Atlantic Ridge) .
Applications
Thin beds. The deep, high resolution measurements (vertical resolution of < 1 ft) can be used in the quantitative evaluation of laminated forms.
Fractured formations . The ARI response is affected by the presence of fractures filled with conductive fluids. Though ARI images do not have the same definition and resolution of FMS images, open fractures are clearly visible; some vertical fractures and cracks that may have been induced by drilling, however, may not be clearly visible on the ARI, because they are too shallow to be detected
by the deeper reading ARI.
Dips. The formation dip can be derived from the ARI images, though the estimate does not have the accuracy of that derived from an FMS image. ARI images are useful to detect uncomformities and faults, and to confirm expected features.
Borehole profile. The 12 auxiliary-mode azimuthal borehole curves show tool eccentering and borehole irregularities, such as ovality. The ARI electrical calipers are more sensitive to borehole variations than the FMS orthogonal calipers.
Environmental Effects
The electrical standoff measurements can be used to correct the azimuthal resistivities for tool eccentering and variations in borehole shape and size.
Log Presentation
The LLD and LLS measurements are usually displayed on a resistivity logarithmic scale, along with the gamma ray log.

Tool Specifications
| Temperature rating: | 350° F (175° C) |
| Pressure rating: | 20 kpsi (13.8 MPa) |
| Diameter: | 3.625 in (9.21 cm) |
| Length: | 33.3 in (10.1 cm) |
| Weight: | 578 lbs (262.4 kg) |
| Sampling interval: | 6 in (15.24 cm) |
| Max. logging speed: | 1,800 ft/hr (550 m/hr) |
Measurement Specifications
| Measurement range: | 0.2 to 100,000 ohm-m |
| Vertical resolution: | Less than 1 ft (30.24 cm) |
Major Outputs
| LLD: | Deep laterolog (ohm-m) |
| LLS: | Deep laterolog (ohm-m) |
Deployment Notes
The ARI was used in combination with density, porosity and gamma ray tools. In order to properly orient the images, however, the ARI had to be used with the GPIT, as is the case for the FMS tool. Repeat passes of the ARI were useful to obtain consistent azimuth measurement.
* ®trademark of Schlumberger