Dual Laterolog (DLL*)
Description
The Dual Laterolog (DLL) provided two resistivity measurements with different depths of investigation into the formation: deep (LLd) and shallow (LLs). In both devices, a current beam 2 ft-thick (A0) was forced horizontally into the formation by using focusing (also called bucking) currents (A1– A2, A’1-A’2); monitoring electrodes (M1, M2, M’1, M’2) were part of a loop that adjusted the focusing currents so that no current flowed in the borehole between the two electrodes. For the deep measurement both measure and focusing currents returned to a remote electrode on the surface; thus, the depth of investigation was greatly improved and the effect of borehole conductivity and of adjacent formations was red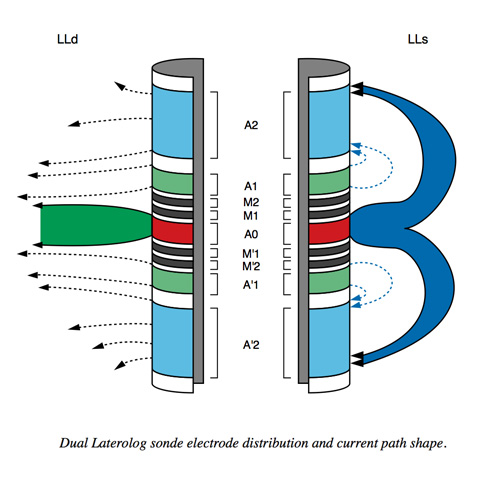 uced. In the shallow laterolog, the return electrodes that measured the bucking currents were located on the sonde and the current sheet thus retained focus over a shorter distance than the deep laterolog.
The Dual Laterolog had a response range of 0.2 to 40,000 ohm-m, whereas the Phasor Dual Induction Tool (DIT) had a range of 0.2 to 2,000 ohm-m. The DLL was useful for igneous environments (e.g., oceanic basalts and gabbros) because the resistivities can be higher than the upper limit of what the DIT can measure. However, in upper crustal environments (seismic Layers 2A and 2B), the resistivities are usually low enough that the DIT can be used. This was the case in data from, for
example, ODP Legs 104 and 152 as well as Hole 395A.
The depth of investigation of the laterolog depended on the resistivity of the rock and on the resistivity contrast between the zone invaded by the drilling fluid and the virgin (uninvaded) zone. The vertical resolution of both LLd and LLs depended on the geometry defined by the focusing electrodes: this is about 2 ft (61 cm).
The DLL was first deployed during DSDP in 1977 and was last used on IODP Expedition 312 in 2005.
Applications
Porosity. Because of the inverse relationship between resistivity and porosity, the dual laterolog could be used to compute the porosity of the rock from Archie’s equation if the sediments/rocks do not contain any clay or if the contribution of surface conduction to the signal is negligible.
Fracture porosity. This could be estimated from the separation between the deep and shallow measurements based on the observation that the former was sensitive to the presence of horizontal conductive features only, while the latter responded to both horizontal and vertical conductive structures.
Environmental Effects
For the LLD, the borehole effect was small for hole diameters up to 16 in, while the LLS provided good readings in holes not exceeding 12 in. Corrections were available for holes up to 20 in (25 cm) in diameter.
Log Presentation
The LLD and LLS curves were usually displayed on a resistivity logarithmic scale, along with the gamma ray log.
Tool Specifications
| Temperature rating: | 350° F (175° C) |
| Pressure rating: | 20 kpsi (138 MPa) |
| Diameter: | 3.625 in (9.21 cm) |
| Length: | 30.6 ft (9.35 m) |
| Weight: | 222 lbs (100.8 kg) |
| Sampling interval: | 6 in (15.24 cm) |
| Max. logging speed: | 10,000 ft/hr (3,048 m/hr) |
Measurement Specifications
| Range: | 0.2-40,000 ohm-m |
| Depth of investigation: | (see discussion in “Description” section) |
| Vertical resolution: | 2.5 ft (76 cm) |
Major Outputs
| LLD: | Deep laterolog (ohm-m) |
| LLS: | Shallow laterolog (ohm-m) |
Deployment Notes
The DLL was usually run in combination with a Gamma Ray Tool (GR, SGT, NGT, HNGS).
* ®trademark of Schlumberger