Litho-Density Log (LDT*)
Description
The Litho-Density Log (LDT*) had a 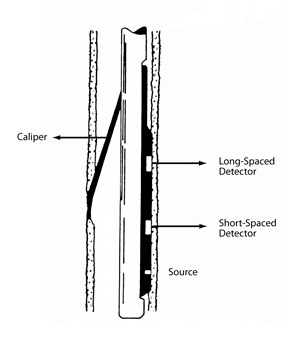 137Cs source and two detectors, all located on a “skid” (a pad held against the borehole wall by a spring-activated arm). The source emitted gamma rays at an energy of 662 keV.
The two detectors (short-spaced and long-spaced) were shielded in such a way that only those gamma rays that traveled through the formation were detected. The use of two detectors reduced significantly the statistical variations and allowed for more accurate readings of the formation density. The detectors were able to distinguish “hard” and “soft” gamma rays (high and low energy rays, respectively). High energy waves were the result of Compton scattering, while the low energy waves resulted from the photoelectric absorption effect, Pe.
Pe is strongly related to the nature of the formation matrix. The formation porosity and the nature of fluid in the pores have little effect on Pe, so in simple lithology, the measurement is a good matrix indicator all by itself. In complex lithology, the LDT was often combined with the CNT-G to provide a detailed analysis of three-mineral matrices and porosity.The LDT was used during ODP from 1985-1989. It was last deployed during Leg 128.
Applications
Porosity estimate. If grain density is known, porosity can be calculated from thedensity log. Alternatively, porosity and density logs can together be used to calculate grain density.
Seismic impedance. The product of velocity and density can be utilized as input to synthetic seismogram computations.
Lithology and rock chemistry definition. In combination with the neutron log, the density log allows for the definition of the lithology and of lithologic boundaries. Because each element is characterized by a different photoelectric factor, this can be used, alone or in combination with other logs, to determine the lithologic type. Both density and photoelectric effect index are input parameters to some of the geochemical processing algorithms used onshore.
Environmental Effects
A large borehole and poor contact of the tool pad with the borehole wall adversely affected the quality of the readings.
Log Presentation
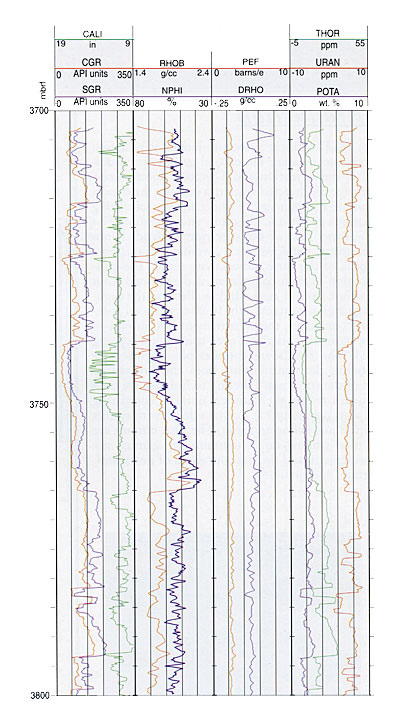
Bulk density was usually displayed alongside the neutron curve. In separate tracks, the density correlation would generally be displayed with the photoelectric effect and caliper alongside the gamma ray:
Tool Specifications
| Temperature rating: | 350° F (177° C ) |
| Pressure rating: | 20 psi (138 MPa) |
| Diameter: | 4 in (10.2 cm) |
| Maximum hole diameter: | 22 in (55.9 cm) |
Major Outputs
| RHOB: | Bulk density (g/cm³) |
| DRHO: | Bulk density correction (g/cm³) |
| PEF: | Photoelectric effect (barn/e–) |
| CALI: | Caliper (in) |
Deployment Notes
The LDT was usually run in comination with the CNT-G and NGT tools.
* ®trademark of Schlumberger