Category Archives: Technology

Wireline

Wireline

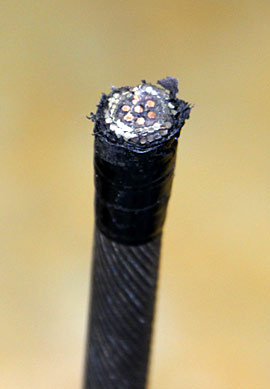
Downhole logging operations are conducted using one of two wireline cable types. The standard cable is a Vector 7-46PXS heptacable, which consists of a core of seven multi-stranded copper wire conductors surrounded by filler and insulation and encased in two layers of high-strength steel armor wires wrapped in opposite directions to counteract torque when the line is placed under tension. The alternate cable utilizes a segment of 7-46PXS cable spliced with a section of Vector M18XS heptacable. The M18XS has similar construction to the 7-46PXS, but is comprised of materials rated for much higher temperatures. The splice is in such a position that the high-temperature portion of the cable will be in the well while the standard segment of the line will provide the additional length required to reach the deeper holes without actually entering those holes itself. wire

Measurement-While-Drilling TeleScope* Tool

Measurement-While-Drilling TeleScope* Tool

Description
The MWD-TeleScope tool is an in-line drill collar that records at-the-bit drilling parameters and telemeters the drilling parameter data as well as data  from other LWD tools to the surface in real time. MWD measurements include downhole weight-on-bit and torque, shocks, temperature, flow rate, rate of penetration, borehole direction and inclination. mwd2 The tool uses a continuous mud wave, or siren-type, telemetry method and incorporates design features and software that enable it to approach data transmission rates of 6 to 12 bits per second.


Tool Specifications
Temperature rating: 350° F (177° C)
Pressure rating: 20 psi (138 MPa)
Length: 28 ft (8.5 m)
Weight: 2,085 lbs (946.6 kg)
API nominal collar outside diameter: 6.75 in (17 cm)
Maximum outside diameter: 6.9 in (17.5 cm)
Minimum bit size: 8.375 in (21.3 cm)
Maximum bit size: 9.875 in (32.5 cm)
Flow range: 250-800 gpm
Pressure drop coeffecient (C)*: 16,000
Maximum curvature – sliding: 15 deg/100 ft (15 deg/31 m)
Maximum rotary torque: 12,000 ft-3,658 m-lbf
Minimum operating RPM: 0 rpm
Uphole connection: 5-1/2 FH box
Downhole connection: 5-1/2 FH box
(*) pressure drop = [mudweight in ppg] x [flow in gpm]²/C


Measurement Specifications
Gamma Ray
Range: 0-300 GAPI
Accuracy: ~13 GAPI
Inclination
Range: 0-180°
Accuracy: ±0.1° (stationary) and ±0.2° (continuous)
Resolution: 0.03° (stationary) and 0.1° (continuous)
Azimuth
Range: 0-360°
Accuracy: ±0.1° (above 5° stationary) and ±0.2° (continuous)
Vertical resolution: 0.5° (stationary) and 1° (continuous)


*®trademark of Schlumberger
Logging-While-Drilling EcoScope* Tool

Logging-While-Drilling EcoScope* Tool

Description
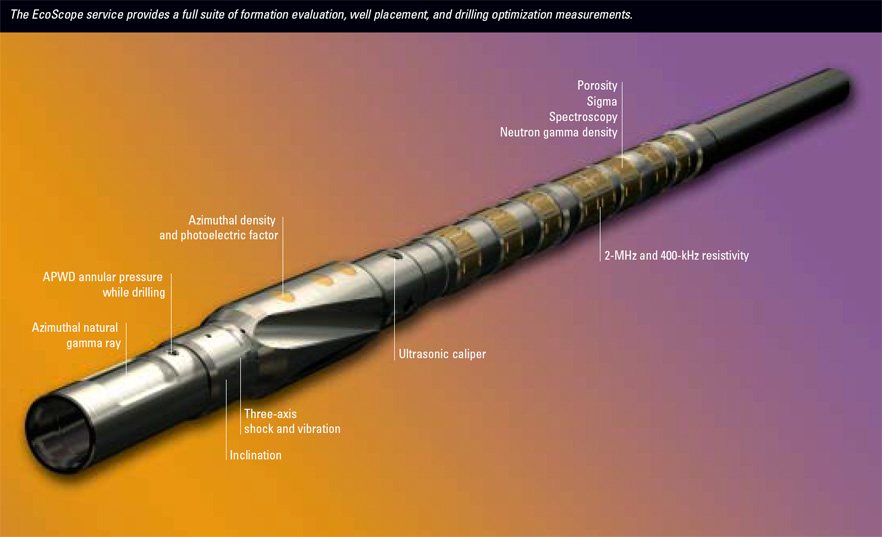
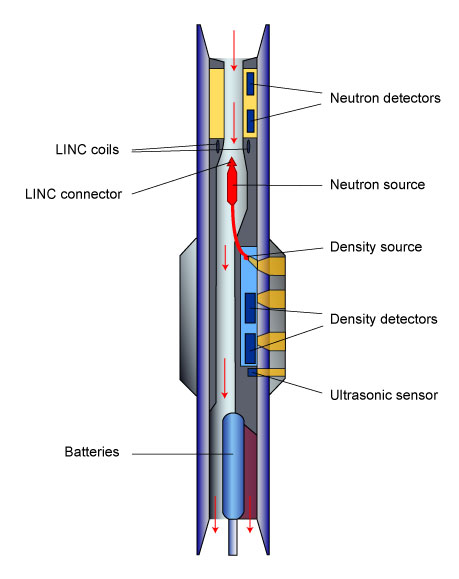
lwd_ecoscopeThe Logging-While-Drilling-EcoScope (LWD-EcoScope) is the first Schlumberger LWD multifunction tool that provides a complete set of formation evaluation measurements without using the traditional chemical sources. A pulsed neutron generator (PNG) replaces the americium-berillium (AmBe) source commonly used for porosity measurements, while an optional neutron gamma density measurement is performed with out the traditional side-mounted Cesium source. This feature considerably reduces the risk previously associated with transportation and operations at the borehole site. Also, the PNG produces more high-energy neutrons than the traditional chemical source, which results in a deeper depth of investigation and therefore more accurate measurements of the properties of the formation. In addition to density and porosity measurements, the EcoScope offers the first LWD measurement of neutron-induced elemental gamma ray spectroscopy and sigma; these data provide mineralogy, lithology and matrix properties. Phase and attenuation resistivity at two frequencies (originally from ARC tool) and gamma ray, as well as some drilling parameters such as annular pressure-while-drilling, caliper, and shock complete the suite of measurements provided by the EcoScope.
All drilling and measurement sensors are mounted on a single collar mounted close to the bit that can be deployed faster than conventional LWD tools; all EcoScope measurements are delivered in real-time to the surface via TeleScope high speed telemetry. The EcoScope large memory capacity allows for the recording of data at 2 points/ft (30.48 cm) at penetration rates up to 450 ft/hr (137 m/hr).


Applications
• Formation lithology and physical property evaluation
• Formation mineralogy from elemental gamma spectroscopy
• Drilling performance evaluation


Tool Specifications
Temperature rating: 300° F (149° C)
Pressure rating: 20 kpsi (138 MPa)
Length: 28 ft (8.5 m)
Weight: 3,200 lbs (1,453 kg)
API nominal collar outside diameter: 6.75 in (17 cm)
Maximum outside diameter: 7.875 to 9.375 in (20 to 23.8 cm)
Minimum bit size: 8.375 in (21.3 cm)
Maximum bit size: 9.875 in (32.5 cm)
Flow range: 250-800 gpm
Maximum curvature – sliding: 16 deg/100 ft (16 deg/31 m)
Minimum operating RPM: 30 rpm
Uphole connection: 5-1/2 FH box
Downhole connection: 5-1/2 FH box
(*) pressure drop = [mudweight in ppg] x [flow in gpm]²/C


Measurement Specifications
Gamma Ray
Range: 0-250 GAPI
Accuracy: 7%
Vertical resolution: 6 in (15.24 cm)
Resistivity
Range: 0.2-3,000 Ω.m
Accuracy: 2% (<6 Ω.m); ±0.3 msec/m (>6 Ω.m)
Vertical resolution: 8.4 in (21.33 cm)
Density
Range: 1.7-3.05 g/cm³
Accuracy: 0.015 g/cm³
Vertical resolution: 6 in (15.24 cm)
Porosity
Range: 0-100 pu
Accuracy: ±0.5 pu (<10 pu); ±5% (10-50 pu)
Vertical resolution: 12 in (30.48 cm)
Photoelectric Effect
Range: 1-10 barns/e-
Accuracy: 5%
Vertical resolution: 2 in (5.08 cm)


Main Outputs
RHOB: Bulk Density (g/cm³)
DRHO: Density Correction (g/cm³)
DRRT: Correction for rotational density (g/cm³)
IDDR: Image Derived Density Correction (g/cm³)
IDPE: Image Derived Photoelectric Effect (g/cm³)
PEF: Photoelectric Effect (barns/e-)
TNPH: Thermal Neutron Porosity (%)
BPHI: Best Thermal Neutron Porosity, Average (%)
DCAL: Differential Caliper (in)
GRMA: Gamma Ray, Average (GAPI units)
PnB: Phase Shift Resistivity Blended, n=16, 22, 28, 34, 40 in (Ω.m)
PnH: Phase Shift Resistivity, 2 MHz, n=16, 22, 28, 34, 40 in (Ω.m)
PnL: Phase Shift Resistivity, 400 KHz, n=16, 22, 28, 34, 40 in (Ω.m)
AnB: Attenuation Resistivity Blended, n=16, 22, 28, 34, 40 in (Ω.m)
AnH : Attenuation Resistivity, 2 MHz, n=16, 22, 28, 34, 40 in (Ω.m)
AnL: Attenuation Resistivity, 400 KHz, n=16, 22, 28, 34, 40 in (Ω.m)
APRS: Annulus Pressure (psi)
ATMP: Annulus Temperature (degC)
ECD: Equivalent Circulating Density (lb/gal)
DWAL_WALK2: Dry Weight % Pseudo Aluminum (Walk2 Mode)
DWCA_WALK2: Dry Weight % Pseudo Calcium (Walk2 Mode)
DWFE_WALK2: Dry Weight % Pseudo Iron (Walk2 Mode)
DWGD_WALK2: Dry Weight % Pseudo Gadolinium (Walk2 Mode)
DWK_WALK2: Dry Weight % Pseudo Potassium (Walk2 Mode)
DWSI_WALK2: Dry Weight % Pseudo Silicon (Walk2 Mode)
DWSU_WALK2: Dry Weight % Pseudo Sulfur (Walk2 Mode)
DWTI_WALK2: Dry Weight % Pseudo Titanium (Walk2 Mode)
AGTM: Gamma Ray Time After Bit (s)
ARTM: Resistivity Time After Bit (s)
TAB_DEN: Density Time after Bit (s)
TAB_NEU: Neutron Time after Bit (s)
ROP5_RM: Rate of Penetration, average over last 5 ft (m/hr)
RPM: Tool Rotational Speed (rpm)
*®trademark of Schlumberger
Logging-While-Drilling geoVISION* Tool

Logging-While-Drilling geoVISION* Tool

Description
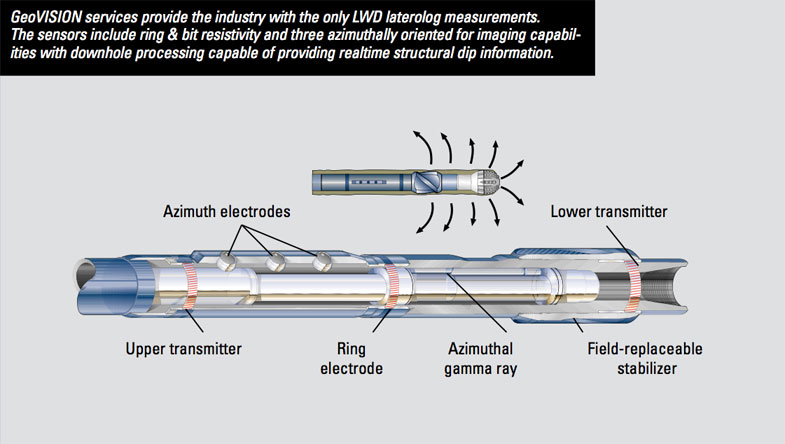
rablargeThe Logging-While-Drilling-geoVISION (LWD-geoVISION) tool makes laterolog resistivity measurements. As a formation evaluation tool, its application is limited to conductive muds. It may be run in several configurations and provides up to five resistivity measurements. The geoVISION contains a scintillation gamma ray detector which supplies a total gamma ray measurement. An azimuthal positioning system allows both gamma ray and various resistivity measurements to be acquired around the borehole. Additional measurements are chassis temperature and radial and longitudinal shocks.

The geoVISION has a nominal 6.75-in (17 cm) diameter; it is meant to be run in 8.5-in (21.6 cm) holes. Designed to be a flexible component of the bottom hole assembly, the GVR6 may be connected directly behind the bit or further back in the bottom hole assembly.

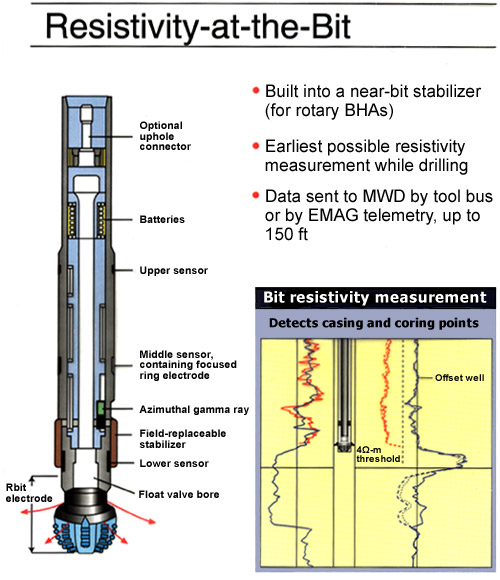
resistA 1.5-in (3.8 cm) tall cylindrical electrode, located 3 feet from the bottom of the tool, provides a focused lateral resistivity measurement (RING) with a 2-in (5 cm) vertical resolution, independent of the location of the RAB tool in the bottom hole assembly. In addition, the RAB sub has three longitudinally spaced button electrodes that provide staggered depths of investigation. As the tool rotates, azimuthal measurements are acquired from the button electrodes. When connected directly to the bit, the geoVISION uses the lower portion (8-in; 20.3 cm) of the tool and the bit as a measure electrode. In this configuration, it provides a bit resistivity measurement (RBIT) with a vertical resolution just a few inches longer than the length of the bit.

The geoVISION measurements have a high vertical and azimuthal resolution. To make the most of the vertical resolution, the optimal sampling density is greater than one sample every inch. At the maximum sampling interval of 10 sec, the optimal sampling density can be achieved for rates of penetration up to 29.5 ft/hr (9 m/hr). Achieving this vertical sampling is most important when imaging.


Applications

The geoVISION tool provides measurements with four depth of investigation  to detect early invasion of borehole fluids into the formation, a sensor at the bit to ensure minimum invasion, azimuthal resistivity images of the borehole to detect resistivity heterogeneity, and a gamma-ray sensor for lithology characterization.

The geoVISION tool can also provide a close look at structural information within a fault zone or an active tectonic area with a resolution of 6-12 in (15-30 cm). The geoVISION measures oriented resistivity images of the borehole wall, similar to the FMS tool. Fracture orientations and distributions can be observed as resistivity contrasts in the image logs and are critical to recognize the extent of the deformation front along a tectonic front. Conversion of geoVISION images into relative porosity using Archie’s equation can be used in combination with density and porosity data to help define the azimuthal distribution of porosity and overpressurized zones which may contribute to fluid flow along planes of structural weakness.


Environmental Effects
The button measurements have a shallow depth of investigation by design, in order to be sensitive to shallow invasion. When the geoVISION tool is centralized in a 8.5-in (21.5 cm) hole, the buttons are 0.1875 in (0.47 cm) from the formation. Controlling this standoff insures correct measurements. Therefore, proper centralization is recommended.
The geoVISION processing automatically corrects the resistivity measurements for frequency effects and the effects of the borehole.


Log Presentation

rab_image

Comparison of geoVISION and Formation MicroImager (FMI)
rab_fmi

Comparison of LWD-GVR6 tool and FMI tool electrical images in consolidated, highly fracture sediments. Both images of the interior of the borehole wall are oriented to the top of the deviated hole. Although the LWD tool has inferior bed resolution (by a factor of 30), it offers the advantage of data coverage around the entire circumference of the borehole and measurements within minutes after the hole has been drilled.


Tool Specifications
Temperature rating 300° F (149° C)
Pressure rating: 18 kpsi (124 MPa)
Length: 10 ft (3.3 m)
Weight: 1,200 lbs (545 kg)
API nominal collar outside diameter: 6.75 in (17.1 cm)
Maximum outside diameter: 7.5 to 8.5 in (19.6 to 21.6 cm)
Minimum bit size: 8.5 in (21.6 cm)
Maximum bit size: 9.875 in (32.5 cm)
Flow range: 0-800 gpm
Pressure drop coeffecient (C)*: 135,000
Maximum curvature – sliding: 16 deg/100 ft (16 deg/31 m)
Maximum rotary torque: 16,000 ft-lbf (4.877 m-lbf)
Minimum operating RPM: 30 rpm
Uphole connection: 5-1/2 FH box
Downhole connection: 5-1/2 Reg box
(*) pressure drop = [mudweight in ppg] x [flow in gpm]²/C


Measurement Specifications 
Gamma Ray
Range: 0-250 GAPI
Accuracy: 7%
Vertical resolution: 1.5 in (3.81 cm)
Deep resistivity 
Range: 0.2-1,000 Ω.m
Depth of investigation: 5 in (12.7 cm)
Accuracy: 5% (<200 Ω.m); 20% (>200 Ω.m)
Vertical resolution: 2-3 in (5.08-7.62 cm)
Medium resistivity 
    Range: 0.2-1,000 Ω.m
Depth of investigation: 3 in (7.62 cm)
Accuracy: 5% (<200 Ω.m); 20% (>200 Ω.m)
Vertical resolution: 2-3 in (5.08-7.62 cm)
Shallow resistivity 
Range: 0.2-1,000 Ω.m
Depth of investigation: 2-3 in (5.08-7.62 cm)
Accuracy: 1 in (2.54 cm)
Vertical resolution: 2-3 in (5.08-7.62 cm)
Ring resistivity
Range: 0.2-200,000 Ω.m
Depth of investigation: 7 in (17.78 cm)
Accuracy: 5% (0.2-200 Ω.m); 20% (>200 Ω.m)
Vertical resolution: 2-3 in (5.08-7.62 cm)
Bit resistivity 
Range: 0.2-200,000 Ω.m
Depth of investigation: 12 in (30.48 cm)
Accuracy: 5% (0.2-200 Ω.m); 20% (>200 Ω.m)
Vertical resolution: 12-24 in (30.48-60.96 cm)


Main Outputs
GR: Gamma ray average (API)
BDAV: Deep resistivity average (Ω.m)
BMAV: Medium resistivity average (Ω.m)
BSAV: Shallow resistivity average (Ω.m)
RBIT: Bit resistivity (Ω.m)
RING: Ring resistivity (Ω.m)
B1TM: Shallow resistivity time after bit (s)
B2TM Medium resistivity time after bit (s)
B3TM: Deep resistivity time after bit (s)
GRTK: Gamma ray time after bit (s)
RBTM: Bit resistivity time after bit (s)
RPM: Rotational speed (rpm)
ROP5: Rate of penetration per 5 ft (m/hr)
RTAB: Ring time after bit (hr or min)
P1AZ: P1 azimuth
HAZI: Azimuth (deg)

Static and dynamic images are output at 3 depths of investigation: medium, shallow, and deep.


*®trademark of Schlumberger
Logging-While-Drilling proVISION* Tool

Logging-While-Drilling proVISION* Tool

Description
lwd_mrt6The Schlumberger Logging-While-Drilling-proVISION (LWD-proVISION) tool performs magnetic resonance measurements in the borehole and transmits them in real-time to the surface. Magnetic resonance provides parameters that are not measured by traditional LWD tools such as permeability, free- and bound fluid-volume, type of fluid, and mineralogy-independent porosity. These allow for an accurate characterization of the formation without use of radioactive sources as well as direct detection of the presence of hydrates.


Applications
• Determination of free vs. bound fluid volume
• Detection of hydrates
• Measurement of mineralogy-independent porosity
• Fluid identification


Tool Specifications
Temperature rating: 300° F (149° C)
Pressure rating: 20 kpsi (138 MPa)
Tool make-up length: 39 ft (11.9 m)
Tool weight: 3,900 lbs (1,771 kg)
API nominal collar outside diameter: 6.75 in (17 cm)
Maximum outside diameter: 7.75 to 10.375 in (20 to 26.4 cm)
Minimum bit size: 8.5 in (26 cm)
Maximum bit size: 10.625 in (27 cm)
Flow range: 250-800 gpm
Pressure drop coeffecient (C)*: 30,000
Maximum curvature – sliding: 16 deg/100 ft (16 deg/31 m)
Maximum rotary torque: 16,000 ft-lbf (4,877 m-lbf)
Minimum operating RPM: 0 rpm
Uphole connection: 5-1/2 FH box
Downhole connection: 5-1/2 FH box
(*) pressure drop = [mudweight in ppg] x [flow in gpm]²/C


Measurement Specifications
Range: 0-100 pu
Vertical resolution: 3.9 ft @ 100 ft /hr (1.19 m @ 30 m/hr)
Porosity accuracy: ±1 pu or 5% (whichever is greater)


Main Outputs
BFV: Bound Fluid Volume (%)
FFV: Free Fluid Volume (%)
MRP: Magnetic Resonance Porosity (%)
T2: T2 Distribution (%)
T2LM: T2 Logarithmic Mean (%)

*®trademark of Schlumberger
Logging-While-Drilling sonicVISION* Tool

Logging-While-Drilling sonicVISION* Tool

Description
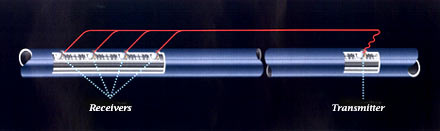
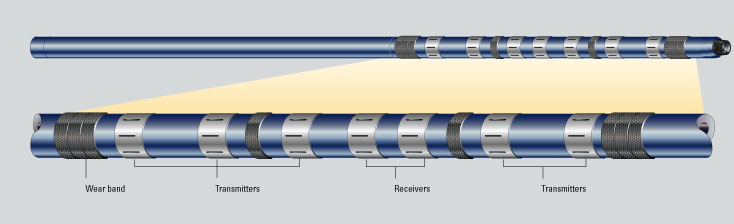
Acoustic waveforms are acquired while drilling with the Schlumberger Logging-While-Drilling-sonicVISION tool (LWD-sonicVISION). One transmitter and four receivers are positioned within a drill collar just above the bit to collect compressional transit times just seconds after the rock has been cut.
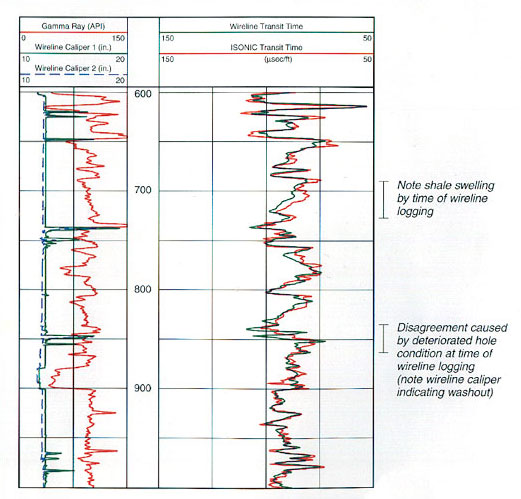
As with all Logging-While-Drilling tools, formation data are collected before the borehole alteration or invasion occurs. The data are stored in memory and dumped upon collar retrieval, or they are pulsed in real time if a MWD tool is in use. Sonic data are then utilized in the traditional manner for sonic velocity, synthetic seismograms and correlation with wireline logs. isonic
Applications
Porosity and “pseudodensity”
The sonic transit time can be used to compute porosity by using the appropriate transform and to estimate fracture porosity in carbonate rocks. In addition, it can be used to compute a “pseudodensity” log over sections where this log has not been recorded or the response was not satisfactory.

Seismic impedance
The product of compressional velocity and density can be used to compute synthetic seismograms for time-depth ties of seismic reflectors.

Sonic waveform analysis
If a refracted shear arrival is present, its velocity can be computed from the full waveforms, and the frequency content and energy of both compressional and shear arrivals can also be determined.

Fracture porosity
Variations in energy and frequency content are indicative of changes in fracture density, porosity, and in the material filling the pores. In some cases compressional-wave attenuation can also be computed from the full waveforms.


Log Presentation
isonplot

Tool Specifications
Temperature rating: 300° F (149° C)
Pressure rating: 25 kpsi (17.2 MPa)
Tool make-up length: 23.8 ft (7.3 m)
Tool weight: 2,600 lbs (1,180.4 kg)
API nominal collar outside diameter: 6.75 in (17 cm)
Maximum outside diameter: 6.9 in (17.5 cm)
Minimum bit size: 8.5 in (21.6 cm)
Maximum bit size: 14 in (35.6 cm)
Flow range: 0-800 gpm
Pressure drop coeffecient (C)*: 256,000
Maximum curvature – sliding: 16 deg/100 ft (16 deg/31 m)
Maximum rotary torque: 16,000 ft-lbf (4.877 m-lbf)
Minimum operating RPM: 0 rpm
Uphole connection: 5-1/2 FH box
Downhole connection: 5-1/2 FH box
(*) pressure drop = [mudweight in ppg] x [flow in gpm]²/C


Measurement Specifications
Range: 40-170 µs/ft
Vertical resolution: 24 in (61 cm)
Accuracy: ±1 µs/ft


Main Outputs
CHRA: Coherence at compression peak, from receiver array
CHTA: Coherence at compression peak, from transmitter array
DTBC: Compressional slowness, borehole compensated (μsec/ft)
DTRA Compressional slowness, from receiver array (μsec/ft)
DTTA: Compressional slowness, computed downhole (μsec/ft)
DTCO: Compressional slowness, computed downhole (μsec/ft)
CHCO: Coherence at compression peak, computed downhole
ISTB: Sonic Time after bit (s)


Deployment Notes
The LWD-sonicVISION is combinable with all other Logging-While-Drilling tools with no reduction in the drilling rate.


*®trademark of Schlumberger

Logging-While-Drilling adnVISION* Tool

Logging-While-Drilling adnVISION* Tool

Description
adnThe Logging-While-Drilling-adnVISION (LWD-adnVISION) tool provides real-time apparent neutron porosity, formation bulk density and photoelectric factor data to characterize formation porosity and lithology while drilling. These nuclear measurements are borehole compensated for improved accuracy. 360-degree images of density and porosity result from the rotation of  the tool’s sensors. Along with the azimuthal data, average values for each parameter are also available.
The adnVISION radioactive sources are safely contained in the drill collar and are connected to each other by a titanium cable that allows fishing by wireline through the drill pipe.


Applications

The adnVISION provides azimuthal borehole compensated formation density, neutron porosity and photoelectric factor measurements. Given present technological capabilities, estimations of bulk porosity and permeability are best made by in situ borehole measurements, preferably at scales large enough to average the effects of irregular fracture porosity and matrix porosity. LWD-adnVISION measurements allow for determining both matrix and fracture porosity and locating overpressure zones.
The adnVISION can be combined with the MWD-TeleScope, which measures parameters such as annulus pressure, torque, and penetration rates. Together, the MWD-TeleScope and adnVISION can render reliable measurements of effective pressure through both normal and overpressurized zones. If overpressurized zones exist within a fault zone, the magnitude and effects of fluid pressure on fault displacement and fluid flow can be assessed by estimating the amount of fluid expulsion (porosity reduction) in the immediate vicinity of the borehole.
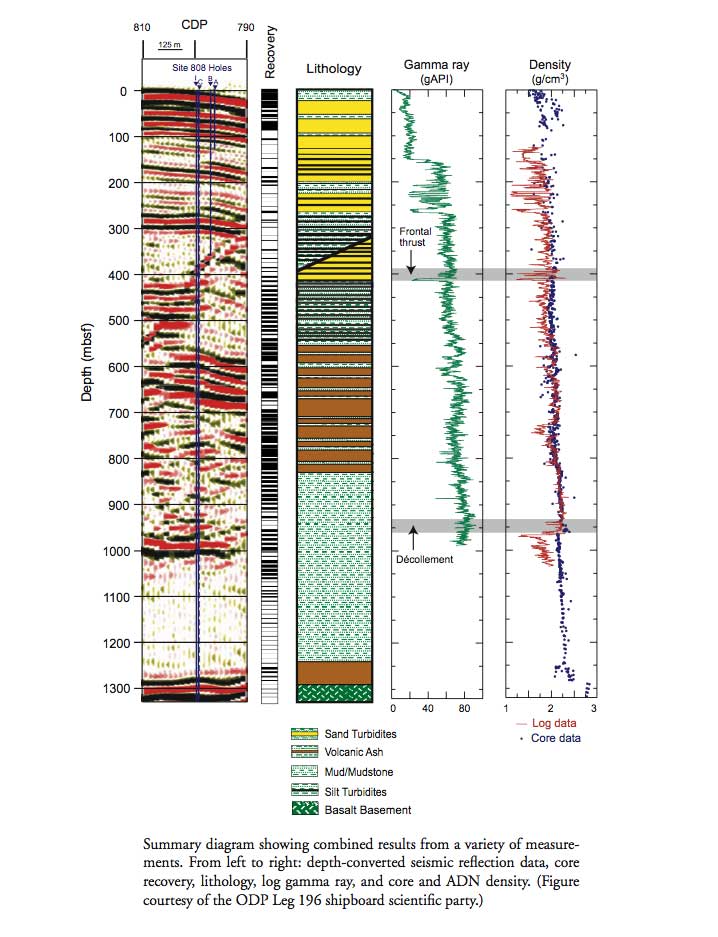
Fault collapse and strain hardening, active fluid flow, fault-fluid interactions, and the formation of hydrofractures may occur within fault zones. Variations in fault displacement and fluid activity can be related to the in situ measurements to investigate the degree to which these processes are active. The adnVISION measurements of porosity and estimations of fluid pressure can illustrate the nature of the pressure seals as well as the physical processes responsible for fluid migration and redistribution along a fault zone or overpressure zones. The determination of the Vp and bulk modulus using LWD-sonicVISION and LWD-adnVISION data can also contribute to the understanding of the mechanical strength of the rocks within and near a fault zone. These LWD azimuthal measurements can be used to provide information regarding the spatial variation of physical properties around the borehole.
The adnVISION measurements can also provide porosity information as a function of borehole azimuth. To estimate strain from in situ porosity, lithological effects on these measurements must be first distinguished from the porosity effects. For this purpose, LWD-geoVISION resistivity and gamma ray measurements can be used to estimate any significant changes in clay mineralogy within a fault zone. Laboratory porosity measurements and thin sections of core samples allow observations of interstitial pore structures and can serve as a correlation tool for more refined calculations of continuous porosity records from the log data. The porosity and resistivity image data can provide information about fracture density, fracture aperture, and structural orientation in the vicinity of the hole. In addition, these data may be used to distinguish fractures that are transmissive from those that are not.


Environmental Effects
Laboratory measurements and mathematical modeling have been used to define the density and photoelectric response and to quantify environmental effects. These effects include gamma ray streaming, mud weight, tool standoff and photoelectric effects of formation and mud on density.
A reliable density measurement requires good contact between stabilizer and formation. Because a statistical caliper measurement is made during the recording, it is possible to check the quality of the contact. Contact also affects the neutron log response; the formation signal, particularly for the epithermal count rates, tends to be masked by the borehole signal with increasing hole size.


Log Presentation

adn_plot


Tool Specifications
Temperature rating:  300° F (150° C)
Pressure rating: 25 kpsi (173 MPa)
Length:  20.5 ft (6.3 m)
Weight: 1,700 lbs (771.8 kg)
API nominal collar outside diameter: 6.75 in (17.1 cm)
Maximum outside diameter: 6.9 to 9.875 in (17.5 to 25 cm)
Flow range: 0-800 gpm
Pressure drop coeffecient (C)*: 135,000
Maximum curvature – sliding: 16 deg/100 ft (16 deg/31 m)
Maximum rotary torque: 16,000 ft-lbf (4.877 m-lbf)
Minimum operating RPM: 30 rpm
Uphole connection: 5-1/2 FH box
Downhole connection: 5-1/2 FH box
(*) pressure drop = [mudweight in ppg] x [flow in gpm]²/C


Measurement Specifications
Porosity
Range: 0-100 pu
Accuracy: ±0.5 pu (<10 pu); 5% (10-50 pu)
Vertical resolution: 12 in (30.48 cm)
Density
Range: 1-3.05 g/cm³
Accuracy: ±0.015 g/cm³
Vertical resolution: 6 in (15.24 cm)
Photoelectric effect 
Range: 0-10 barns/e-
Accuracy: ±5% barns/e-
Vertical resolution: 2 in (5.08 cm)


Main Outputs
RHOB: Bulk density (g/cm³)
DRHO: Bulk density correction (g/cm³)
PEF: Photoelectric factor (barns/e-)
TNPH: Thermal neutron porosity (%)
DCAV: Differential caliper (in)
NTCK: Neutron detector sample depth tick mark
DTCK Density detector sample depth tick mark
ROP5: Rate of penetration, average over last 5 ft (m/hr)
NTAB: Neutron time after bit (s)
DTAB: Density time after bit (s)
RPM: Rotational speed (rpm)


*®trademark of Schlumberger

Logging-While-Drilling arcVISION* Tool

Logging-While-Drilling arcVISION* Tool

Description
arcVISION_schematicThe Logging-While-Drilling-arcVISION (arcVISION) is a compensated array resistivity tool developed by Schlumberger for medium to large boreholes.
The 6.75 in (17 cm) diameter tool makes multiple, borehole-compensated phase shift and attenuation resistivity measurements at two frequencies: 2MHz and 400kHz. The tool’s antenna array consists of five transmitters and two receivers to achieve both a range of depths of investigations as well as borehole compensation. Multiple depths of investigation are useful to differentiate between borehole effects, invasion, shoulder beds, and anisotropy. Borehole compensation is important because it significantly reduces the effects of borehole rugosity. In addition to the resistivity measurements, the arcVISION also provide a non-azimuthal gamma ray measurement performed with a plateau sensor (NaI detector) and annular pressure-while-drilling (APWD), including real-time static pressure.
The arcVISION tool can be operated in memory mode or in real-time mode in combination with the TeleScope MWD tool; also, it is combinable with any other LWD tool.


Applications
Formation anisotropy: The separation between the vertically matched resistivities can be used to discriminate between invasion and formation anisotropy.
Lithology: Identification of impermeable beds – the resistivity curves will match in shales.


Tool Specifications
Temperature rating : 300°F (149°C)
Pressure rating: 25 kpsi (173 MPa)
Length: 18 ft (5.49 m)
Weight: 1,800 lbs (817.2 kg)
API nominal collar outside diameter: 6.75 in (17 cm)
Maximum outside diameter: 7.5 in (19.05 cm)
Minimum bit size: 8.5 in (21.59 cm)
Maximum bit size: 10.5 in (26.67 cm)
Flow range: 0-800 gpm
Pressure drop coefficient (C)*: 121,000
Maximum curvature – sliding: 16 deg/100 ft (16 deg/31 m)
Maximum rotary torque: 0 rpm
Minimum operating RPM: 30 rpm
Uphole connection: 5-1/2 FH box
Downhole connection: 5-1/2 FH box
(*) pressure drop = [mudweight in ppg] x [flow in gpm]²/C


Measurement Specifications
Gamma Ray
Range: 0-250 GAPI
Accuracy: 3%
Statistical resolution: ±2 GAPI at 100 ft/hr (31 m/hr)
Vertical resolution: 6 in (15.24 cm)
Resistivity Attenuation Phase
Range: 0.2-50 Ω.m 0.2-3,000 Ω.m
Accuracy (<25 Ω.m): ±3% ±2%
Accuracy (>25 Ω.m): ±1.5 mmho/m ±0.3 mmho/m
Vertical resolution at 0.2 Ω.m: 12 in (30.48 cm) 8.4 in (21.33 cm)
Pressure While Drilling   
Range: 20 kpsi (137 MPa) 
Accuracy: ±20 psi (137 kPa) 
Vertical resolution: ±1 psi (6.9 kPa)


Main Outputs
GR: Gamma Ray (API units)
PnB: Phase Shift Resistivity Blended, n=16, 22, 28, 34, 40 in (Ω.m)
PnH: Phase Shift Resistivity, 2 MHz, n=16, 22, 28, 34, 40 in (Ω.m)
PnL: Phase Shift Resistivity, 400 KHz, n=16, 22, 28, 34, 40 in (Ω.m)
AnB: Attenuation Resistivity Blended, n=16, 22, 28, 34, 40 in (Ω.m)
AnH : Attenuation Resistivity, 2 MHz, n=16, 22, 28, 34, 40 in (Ω.m)
AnL: Attenuation Resistivity, 400 KHz, n=16, 22, 28, 34, 40 in (Ω.m)
APRS: Annulus Pressure (psi)
ATMP: Annulus Temperature (°C)
ECD: Equivalent Circulating Density (lb/gal)
AGTM: Gamma Ray Time After Bit (s)
ARTM: Resistivity Time After Bit (s)
ROP5_RM: Rate of Penetration, average over last 5 ft (m/hr)
RPM: Tool Rotational Speed (rpm)

*®trademark of Schlumberger

Logging-While-Drilling – Compensated Density Neutron Tool (LWD-CDN*)

Logging-While-Drilling – Compensated Density Neutron Tool (LWD-CDN*)

Description
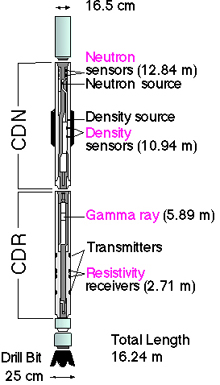
cdr-cdn The physics of the measurements made by the LWD-CDN tool were similar to those of corresponding wireline services. For the neutron porosity measurement, fast neutrons were emitted from a 7.5-curie Americium-Beryllium (Am-Be) source. The quantities of hydrogen in the formation, in the form of water- or oil-filled porosity, primarily control the rate at which the neutrons slow down to epithermal and thermal energies. Neutrons were detected by near-and far-spacing detectors, and ratio processing was used for borehole compensation. The energy of the detected neutrons had an epithermal component because a high percentage of the incoming thermal neutron flux was absorbed as it passed through the 1-in. (2.5 cm) steel wall of the drill collar. Also, a wrap of cadmium under the detector banks shielded them from thermal neutrons arriving from the inner mud channel. This mainly epithermal detection practically eliminated adverse effects caused by thermal absorbers in the borehole or formation.
The density section of the tool used a 1.7-curie 137 Cesium gamma ray source in conjunction with two gain-stabilized scintillation detectors to provide a high-quality, borehole-compensated density measurement. The tool also measured the photoelectric effect for lithology identification.
The density source and detectors were positioned behind a full-gauge clamp-on stabilizer, which excluded mud from the path of the gamma rays, greatly reducing borehole effect. In deviated and horizontal wells, the stabilizer could be run under gauge for directional drilling purposes. Rotational processing provided an important correction in oval holes and yielded a differential caliper.
The CDN was used on several ODP legs from 1994 through 1997. It has been succeeded by the LWD-adnVISION.


Applications – Density Measurement
Porosity: If grain density is known, porosity can be calculated from the density log. Alternatively, porosity and density logs can together be used to calculate grain density.

Seismic impedance: The product of velocity and density can be utilized as input to synthetic seismogram computations.

Lithology and rock chemistry: In combination with the neutron log, the density log allows for the definition of the lithology and of lithologic boundaries. Because each element is characterized by a different photoelectric factor, this can be used, alone or in combination with other logs, to determine the lithologic type. Both density and photoelectric effect index are input parameters to some of the geochemical processing algorithms used onshore.


Applications – Neutron Measurement
Porosity: In reservoir engineering its importance is quite evident; in the study of the volcanic rocks that make up the upper oceanic crust, a good in-situ porosity measurement is most important to the correct understanding of the crustal structure. First, because it samples both the small-scale (microcrack, vesicle) porosity seen in the cores and large-scale fractures not sampled  by drilling, and secondly because other properties such as density, seismic velocity, and permeability depend strictly on porosity variations and on the geometry of the pore space. In the presence of clays or hydrous alteration minerals a correction is required to account for the presence of bound water.

Lithology: Because the hydrogen measured by the tool is present not only as free water but also as bound water in clay minerals, the porosity curve, often combined with the density log, can be used to detect shaly intervals, or minerals such as gypsum, which have a high hydrogen index due to its water of crystallization. Conversely, the neutron curve can be used to identify anhydrite and salt layers (which are both characterized by low neutron readings and by high and low bulk density readings, respectively).


Environmental Effects A reliable density measurement requires good contact between stabilizer and formation. Because a statistical caliper measurement is made during the recording, it is possible to check the quality of the contact. Contact also affects the neutron log response; the formation signal, particularly for the epithermal count rates, tends to be masked by the borehole signal with increasing hole size.


Log Presentation
Bulk density, photoelectric effect, density correction, and caliper were usually displayed along with the neutron porosity curve and the gamma ray log. DRHO and DCAL were useful for quality control of the data; if the tool was operating correctly they should be less than 0.1 g/cc and 1 in., respectively.


Tool Specifications
Temperature rating:  -13° to 300° F (-25° to 150° C)
Pressure rating: 18 kpsi (124 MPa)
Length: 30.6 ft (9.3 m)
Weight: 2000 lbf (907 kg)
Maximum weight on bit : F = 63,000,000/L² lbm (where L is the distance between stabilizers in feet)
Maximum flow rate: 600 gal/min
Available collar sizes: 6.75 in, 8.25 in (17.1 cm, 21 cm)
Availablestabilizers: 8.50 in, 9.75 in (21.6 cm, 24.8 cm)


Main Outputs
DCAL: Differential caliper (in)
DRHO: Bulk density correction (g/cm3)
PEF: Photoelectric effect (barns/e-)
ROMT: Max. density total (g/cm3) from rotational processing
TNPH: Thermal neutron porosity (%)
DTAB: Density time after bit (hr)
NTAB: Neutron time after bit (hr)


*®trademark of Schlumberger

Ultra-High Temperature Multi-Sensor Memory Tool (UHT-MSM)

Ultra-High Temperature Multi-Sensor Memory Tool (UHT-MSM)

Description
The Ultra-High Temperature Multi-Sensor Memory Tool (UHT-MSM), developed by the Geophysical Research Corporation for the University of Miami under NSF funding, is a slim-hole memory tool capable of measuring pressure and temperature in hot boreholes. It was deployed for the first time during ODP Leg 169.
The UHT-MSM contains internal and external temperature measuring devices, a pressure gauge, a multi-sensor memory unit, and a dewar flask that acts as an insulator to maintain a stable temperature and cool-down rate for the tool. The heat shield is aircraft-grade aluminum bound at both ends by brass heat sinks. The dewar flask can maintain an internal temperature suitable for tool operation for 4-5 hours at an external temperature of about 750° F (400° C). Operations are possible for up to 10 hours if the temperature does not exceed 450° F (232° C).

uht_msm_fig1
Applications
Hydrogeology: Temperature excursions can be used to identify regions of fluid inflow or outflow.
Geothermics: Combined with thermal conducty measurements on the core recovered, it can provides an estimate of the fluid flow regime.
Safety: It provides an evaluation of fluid temperature prior to deploying heat sensitive tools.


Environmental Effects Tool response can be affected by borehole size and circulation of fluids during drilling operations. Down flow of colder and denser ocean bottom water after drilling into the borehole can affect the temperature profiles.


Log Presentation
uht_msm_fig2
Tool Specifications
Temperature rating: 400°C (750°F) for 4-5 hours 
Pressure rating: 10 kpsi (69 MPa)
Diameter: 2.2 in (5.58 cm)
Length: 8.75 ft (2.66m)
Weight: 75 lbs (34.1 kg)
Sampling Rate: From 20 msec to 65 days
Memory: 1 Mb
Power source: Lithium batteries
Battery life: >8 hrs


Measurement Specifications
Temperature
        Range: 0-500°C (32-932°F)
        Resolution: 28 Hz/°C (15.6 Hz/°F)
        Accuracy: 1.67°C (3°F)
Pressure
        Range: 0-10 kpsi (0-69 MPa)
        Accuracy: <0.01 psi (68.94 Pa)
        Resolution: 0.04 % of full scale