Geochemical Logging Tool (GLT*)
Description
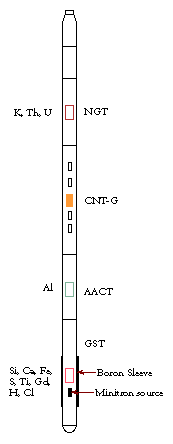 The Geochemical Logging Tool (GLT) used three separate modes of gamma-ray spectroscopy to obtain measurements of most of the major oxides that make up sedimentary and igneous rocks. Initial measurements provided estimates of Si, Al, Fe, Ca, K, U and Th (together with H and Cl). Estimates of Ti, S and Gd were obtained later with further processing. The GLT provided gross geochemical information about the formation which was particularly useful when combined with other logs. The data could be used directly for the characterizationof geological sequences and phenomena, and were excellent for geotechnical zoning. However, due to its relatively low measurement precision (see the Environmental Effect section below), the GLT was best employed in environments where thereis a marked variation in the geochemistry of the rocks.
The GLT consisted of four components. At the top was a Natural Gamma Ray Tool (NGT), which measured the abundance of K, U, and Th from the natural gamma radiation given out by these elements. A sodium iodide detector was used for the measurement and also provided a spectrum of the background radiation, which was required for subsequent processing. Data were collected as the tool string was pulled up the borehole so that natural gamma-ray measurements were made before the formation was activated by the neutron and gamma spectroscopy tools below the NGT.
Beneath the NGT was a Compensated Neutron Porosity Tool (CNTG), which in the GLT was used solely as a carrier for a Californium (252Cf) source. Californium was used instead of the conventional AmBe source because its spectrum has a lower energy (2 MeV instead of 4.5 MeV), thus reducing the number of fast neutron reactions that could interfere with measurements taken by the tools below. The source in the CNTG caused the neutron activation of Al, in which the natural isotope 27Al absorbed thermal neutrons and produced the isotope 28Al, which decays with a half life of 2.24 minutes and emits 1.78 MeV gamma rays.
Next was the aluminum activation clay tool (AACT), which was essentially an NGT with a modified spectrometer (7 windows instead of 5) to allow a more detailed analysis of the spectrum. The aluminum activation clay tool measured the gamma spectrum of the activated formation and the Al component was determined by subtracting the input from the natural gamma ray tool spectrum. There was often some spectral interference in the aluminum measurement from silicon, which was corrected during the land-based processing.
Finally, a gamma ray spectrometry tool (GST) was located at the bottom of the string. A boron exclusion sleeve surrounded the GST and increased the signal-to-noise ratio by shielding the path of fast neutrons from borehole fluid and reducing the number of capture reactions in the borehole itself, thus counteracting the effects of chlorine and water present in the borehole. The sleeve also reduced the interference of iron from the tool housing. The GST used a “minitron” tritium source to bombard the formation with pulsed 14 MeV neutrons. Through scattering reactions with the atoms in the formation, the neutrons progressively lose energy until they reach a thermal energy at which they can be captured by elemental nuclei in the rock. When this occurs the nucleus emits a gamma ray at a unique energy, characteristic for each element. The emitted gamma rays were measured by a spectrometer consisting of a sodium iodide detector and a 256-channel analyzer. During logging, the gamma ray spectrometry tool provided estimates of Si, Fe, Ca, S, Cl and H. In ODP boreholes the Cl and H related virtually entirely to the sea water in the borehole. Later land-based processing permitted the removal of Cl and H from the spectra, and the additional extraction of estimates for Ti and Gd.
The GST could operate in two timing modes: inelastic, which mainly measured the neutron reactions in the high energy range; and capture-tau mode, which employed prompt neutron capture reactions to measure elemental concentrations. This page describes how the gamma ray spectrometry tool functioned in capture-tau mode, which is how it was normally used in the Ocean Drilling Program.
The elements measured by the GLT account for the bulk of the chemistry of most common rocks; the only significant elements not measured were Na, Mg and possibly Mn. Under favorable circumstances, an estimate of these missing elements could be obtained by comparing a calculation of the photoelectric factor (Pe) from the elements measured above, with the direct measurement of Pe made by the Hostile Environment Lithodensity Tool (HLDS). The difference in these Pe values is, within limits of error, due to the unmeasured elements, and may be recast as either Na or Mg, or some combination, where a fixed ratio of the elements has to be assumed.
The GLT was run for the first time on ODP Leg 118. (Before then, only the GST component was run.) It was last deployed on ODP Leg 185 in 1999.
Applications
Lithology
 In basement, variations in elemental concentrations will help delineate flow boundaries and characterize alteration vein-filling. In sedimentary environments, where there is a reasonable chemical variation in the rocks, GLT data can be used as an effective indicator of changes in the lithostratigraphy.
Cyclically interbedded lithologies can be identified and analyzed using geochemical logging, and changes in the provenance of sediments can be shown. For example, the FeO, SiO2 andCaCO3 results from ODP Hole 950A on the Madeira abyssal plain show distinct downhole alternations (see Figure 2) . Horizons which are generally rich in FeO, rich in SiO2 and poor in CaCO3 show the position of clay-rich organic and volcanic distal turbidites, sourced from volcanic islands and the African margin, to the east of the drill-site. Horizons generally poor in FeO, poor in SiO2, and rich in CaCO3 show the position of calc-turbidites, sourced from a chain of seamounts to the west of the plain.
The ratio of certain elemental yields can also be used to emphasize fluctuations or distinct marker horizons in the stratigraphy. For example, elemental yield ratios were used to analyze data from ODP Hole 999B, drilled beneath the Caribbean Sea. The lithology (Si/(Si + Ca)), iron (Fe/(Si + Ca)) and porosity (H/(Si + Ca)) indicator ratios all help to highlight the position of tephra horizons within the formation (see Figure 3). Geochemistry
Downhole fluctuations in the elemental yields reflect gross variations in geochemistry, which can be used to help categorize the formation. The GLT results from Hole 735B, logged during Leg 118, show a good example of this. This hole penetrated basement of the Southwest Indian Ridge, which between 50-400 mbsf can be subdivided into four distinct units (see Figure 4). The geochemical data clearly delineate Unit 4, which is a Fe-Ti oxide-rich gabbro. Generally low and uniform FeO and TiO2 values occur in Unit 5, which is a relatively uniform olivine gabbro.
Quantitative mineralogy and lithology The oxide data, in combination with data from other logs if appropriate, can be inverted to estimate the proportions of the main minerals in the rock. This information, which can be displayed as mineralogical logs, can often be used to derive other physical properties of the formation, such as magnetic susceptibility or cation exchange capacity (CEC).
Environmental Effects
During data acquisition the signal-to-noise ratio of the gamma ray measurement could be affected by the following:
Logging speed: This is normally between 400 and 600 ft/hr, with measurements being made every six inches. The slower the logging speed the greater the measurement precision.
Borehole fluids and porosity: Due to the large capture cross-section of chlorine and hydrogen more than half of the gamma ray spectrometry tool signal may come from the borehole fluid (normally seawater). This can adversely affect the measurement precision of the other element yields. High porosity rocks can have a similar affect on precision, and it is recommended that the GLT only be used in rocks with less than 40% porosity.
Hole size: This is of particular importance as oversized holes cause an increase in the signal derived from the borehole fluids, and a decrease in the signal from theformation. The interpretation of geochemical logs should, therefore, always be undertaken in conjunction with caliper logs. Because the aluminum activation clay tool has a low activation energy (2 MeV), aluminum is measured in a much smaller volume of rock than those elements measured by the gamma spectroscopy tool. As a result, with increasing hole size, the aluminum signal decreases rapidly and may reach background levels, whereas the gamma spectroscopy tool elements can still be measured. This problem is compounded by the oxide closure procedure, which forces the major oxides to a constant sum (usually 100%).
Temperature: Temperature effects can significantly reduce the efficiency of the NaI detector in the gamma ray spectrometry tool, with higher temperatures resulting in a poor signal-to-noise ratio and decreased resolution. Poor resolution will result in gamma-ray peaks appearing in the wrong window and lead to incorrect identification of the element represented. It is recommended that the GLT not be used in temperatures greater than 150°C.
The quality of the data could also be reduced during processing. This could occur due to errors in the spectral inversion of the raw data, inaccuracies in the oxide closure model caused by the presence of unmeasured elements, and incorrect oxide factor assumptions. In the ODP, shipboard data (particularly petrographic, chemical and diffraction) could often be used to minimize these errors.
One limitation of the GLT was its relatively low spatial resolution. The volume sampled by the GLT approximated to a sphere, with a radius varying from around 0.3-1.0 m, depending on lithology, porosity, composition of the pore fluids and the elemental spectra being determined. At each measurement point (every 15 cm) a number of these spherical samples were averaged. The raw data from the GLT had, therefore, already undergone a certain amount of smoothing. This accentuated the shoulder effect on the logs, which tended to smooth the log responses over sharp lithological boundaries.Comparisons between GLT-derived oxide estimates and similar data obtained from conventional geochemical analyses (e.g., XRF)on core samples should be treated with extreme caution. The two techniques measure substantially different volumes of rock. Furthermore, it is always difficult to precisely match the depths of the core samples with those of the log values, especially when core recovery is low.
Log Presentation
Following data acquisition, the elemental concentrations measured by the GLT were expressed as decimal fractions and the elements were normalized to unity. Further processing, sometimes referred to as the “oxide closure procedure,” converted the major elements (Si, Al, Ca, Fe, S, Ti, K, Cl and H) to weight percent oxides. The trace elements (U, Th and Gd) were expressed in parts per million. Post-cruise processing also allowed the expected errors on the GLT data to be calculated (see Figure 2).
Tool Specifications
*®trademark of Schlumberger
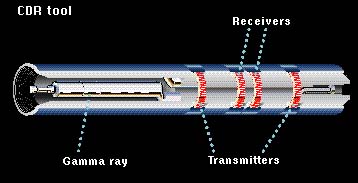
Figure 1. Schematic of the GLT tool
The GLT consisted of four components. At the top was a Natural Gamma Ray Tool (NGT), which measured the abundance of K, U, and Th from the natural gamma radiation given out by these elements. A sodium iodide detector was used for the measurement and also provided a spectrum of the background radiation, which was required for subsequent processing. Data were collected as the tool string was pulled up the borehole so that natural gamma-ray measurements were made before the formation was activated by the neutron and gamma spectroscopy tools below the NGT.
Beneath the NGT was a Compensated Neutron Porosity Tool (CNTG), which in the GLT was used solely as a carrier for a Californium (252Cf) source. Californium was used instead of the conventional AmBe source because its spectrum has a lower energy (2 MeV instead of 4.5 MeV), thus reducing the number of fast neutron reactions that could interfere with measurements taken by the tools below. The source in the CNTG caused the neutron activation of Al, in which the natural isotope 27Al absorbed thermal neutrons and produced the isotope 28Al, which decays with a half life of 2.24 minutes and emits 1.78 MeV gamma rays.
Next was the aluminum activation clay tool (AACT), which was essentially an NGT with a modified spectrometer (7 windows instead of 5) to allow a more detailed analysis of the spectrum. The aluminum activation clay tool measured the gamma spectrum of the activated formation and the Al component was determined by subtracting the input from the natural gamma ray tool spectrum. There was often some spectral interference in the aluminum measurement from silicon, which was corrected during the land-based processing.
Finally, a gamma ray spectrometry tool (GST) was located at the bottom of the string. A boron exclusion sleeve surrounded the GST and increased the signal-to-noise ratio by shielding the path of fast neutrons from borehole fluid and reducing the number of capture reactions in the borehole itself, thus counteracting the effects of chlorine and water present in the borehole. The sleeve also reduced the interference of iron from the tool housing. The GST used a “minitron” tritium source to bombard the formation with pulsed 14 MeV neutrons. Through scattering reactions with the atoms in the formation, the neutrons progressively lose energy until they reach a thermal energy at which they can be captured by elemental nuclei in the rock. When this occurs the nucleus emits a gamma ray at a unique energy, characteristic for each element. The emitted gamma rays were measured by a spectrometer consisting of a sodium iodide detector and a 256-channel analyzer. During logging, the gamma ray spectrometry tool provided estimates of Si, Fe, Ca, S, Cl and H. In ODP boreholes the Cl and H related virtually entirely to the sea water in the borehole. Later land-based processing permitted the removal of Cl and H from the spectra, and the additional extraction of estimates for Ti and Gd.
The GST could operate in two timing modes: inelastic, which mainly measured the neutron reactions in the high energy range; and capture-tau mode, which employed prompt neutron capture reactions to measure elemental concentrations. This page describes how the gamma ray spectrometry tool functioned in capture-tau mode, which is how it was normally used in the Ocean Drilling Program.
The elements measured by the GLT account for the bulk of the chemistry of most common rocks; the only significant elements not measured were Na, Mg and possibly Mn. Under favorable circumstances, an estimate of these missing elements could be obtained by comparing a calculation of the photoelectric factor (Pe) from the elements measured above, with the direct measurement of Pe made by the Hostile Environment Lithodensity Tool (HLDS). The difference in these Pe values is, within limits of error, due to the unmeasured elements, and may be recast as either Na or Mg, or some combination, where a fixed ratio of the elements has to be assumed.
The GLT was run for the first time on ODP Leg 118. (Before then, only the GST component was run.) It was last deployed on ODP Leg 185 in 1999.
Applications
Lithology
In basement, variations in elemental concentrations will help delineate flow boundaries and characterize alteration vein-filling. In sedimentary environments, where there is a reasonable chemical variation in the rocks, GLT data can be used as an effective indicator of changes in the lithostratigraphy.
Cyclically interbedded lithologies can be identified and analyzed using geochemical logging, and changes in the provenance of sediments can be shown. For example, the FeO, SiO2 andCaCO3 results from ODP Hole 950A on the Madeira abyssal plain show distinct downhole alternations (see Figure 2) . Horizons which are generally rich in FeO, rich in SiO2 and poor in CaCO3 show the position of clay-rich organic and volcanic distal turbidites, sourced from volcanic islands and the African margin, to the east of the drill-site. Horizons generally poor in FeO, poor in SiO2, and rich in CaCO3 show the position of calc-turbidites, sourced from a chain of seamounts to the west of the plain.
The ratio of certain elemental yields can also be used to emphasize fluctuations or distinct marker horizons in the stratigraphy. For example, elemental yield ratios were used to analyze data from ODP Hole 999B, drilled beneath the Caribbean Sea. The lithology (Si/(Si + Ca)), iron (Fe/(Si + Ca)) and porosity (H/(Si + Ca)) indicator ratios all help to highlight the position of tephra horizons within the formation (see Figure 3).
Downhole fluctuations in the elemental yields reflect gross variations in geochemistry, which can be used to help categorize the formation. The GLT results from Hole 735B, logged during Leg 118, show a good example of this. This hole penetrated basement of the Southwest Indian Ridge, which between 50-400 mbsf can be subdivided into four distinct units (see Figure 4). The geochemical data clearly delineate Unit 4, which is a Fe-Ti oxide-rich gabbro. Generally low and uniform FeO and TiO2 values occur in Unit 5, which is a relatively uniform olivine gabbro.
Quantitative mineralogy and lithology The oxide data, in combination with data from other logs if appropriate, can be inverted to estimate the proportions of the main minerals in the rock. This information, which can be displayed as mineralogical logs, can often be used to derive other physical properties of the formation, such as magnetic susceptibility or cation exchange capacity (CEC).
Environmental Effects
During data acquisition the signal-to-noise ratio of the gamma ray measurement could be affected by the following:
Logging speed: This is normally between 400 and 600 ft/hr, with measurements being made every six inches. The slower the logging speed the greater the measurement precision.
Borehole fluids and porosity: Due to the large capture cross-section of chlorine and hydrogen more than half of the gamma ray spectrometry tool signal may come from the borehole fluid (normally seawater). This can adversely affect the measurement precision of the other element yields. High porosity rocks can have a similar affect on precision, and it is recommended that the GLT only be used in rocks with less than 40% porosity.
Hole size: This is of particular importance as oversized holes cause an increase in the signal derived from the borehole fluids, and a decrease in the signal from theformation. The interpretation of geochemical logs should, therefore, always be undertaken in conjunction with caliper logs. Because the aluminum activation clay tool has a low activation energy (2 MeV), aluminum is measured in a much smaller volume of rock than those elements measured by the gamma spectroscopy tool. As a result, with increasing hole size, the aluminum signal decreases rapidly and may reach background levels, whereas the gamma spectroscopy tool elements can still be measured. This problem is compounded by the oxide closure procedure, which forces the major oxides to a constant sum (usually 100%).
Temperature: Temperature effects can significantly reduce the efficiency of the NaI detector in the gamma ray spectrometry tool, with higher temperatures resulting in a poor signal-to-noise ratio and decreased resolution. Poor resolution will result in gamma-ray peaks appearing in the wrong window and lead to incorrect identification of the element represented. It is recommended that the GLT not be used in temperatures greater than 150°C.
The quality of the data could also be reduced during processing. This could occur due to errors in the spectral inversion of the raw data, inaccuracies in the oxide closure model caused by the presence of unmeasured elements, and incorrect oxide factor assumptions. In the ODP, shipboard data (particularly petrographic, chemical and diffraction) could often be used to minimize these errors.
One limitation of the GLT was its relatively low spatial resolution. The volume sampled by the GLT approximated to a sphere, with a radius varying from around 0.3-1.0 m, depending on lithology, porosity, composition of the pore fluids and the elemental spectra being determined. At each measurement point (every 15 cm) a number of these spherical samples were averaged. The raw data from the GLT had, therefore, already undergone a certain amount of smoothing. This accentuated the shoulder effect on the logs, which tended to smooth the log responses over sharp lithological boundaries.Comparisons between GLT-derived oxide estimates and similar data obtained from conventional geochemical analyses (e.g., XRF)on core samples should be treated with extreme caution. The two techniques measure substantially different volumes of rock. Furthermore, it is always difficult to precisely match the depths of the core samples with those of the log values, especially when core recovery is low.
Log Presentation
Following data acquisition, the elemental concentrations measured by the GLT were expressed as decimal fractions and the elements were normalized to unity. Further processing, sometimes referred to as the “oxide closure procedure,” converted the major elements (Si, Al, Ca, Fe, S, Ti, K, Cl and H) to weight percent oxides. The trace elements (U, Th and Gd) were expressed in parts per million. Post-cruise processing also allowed the expected errors on the GLT data to be calculated (see Figure 2).
Tool Specifications
| Temperature rating: | 300°F (150°C) |
| Pressure rating: | 20 kpsi (138 MPa) |
| Diameter: | 3.875 in (9.2 cm) |
| Length: | 69 ft (21 m) |
| Sampling interval: | 6 in (15.24 cm) |
| Maximum logging speed: | 600 ft/hr (182.88 m/hr) |
*®trademark of Schlumberger