Category Archives: Technology

Modular Temperature Tool (MTT)

Modular Temperature Tool (MTT)

Description
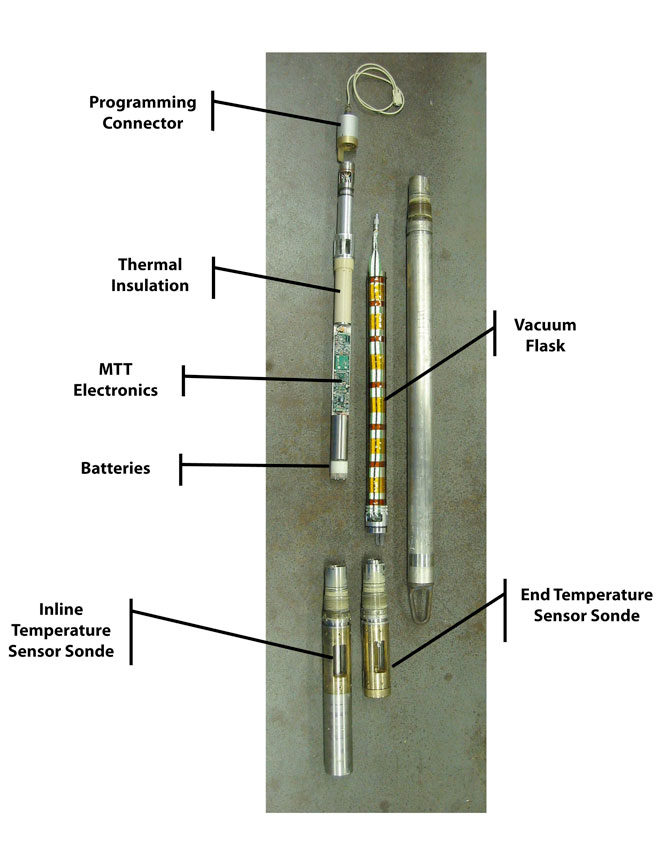
The Modular Temperature Tool (MTT) is a flexible, general-purpose third party temperature logging tool developed by the Lamont-Doherty Earth Observatory Borehole Research Group. It replaces two previous temperature logging tools: 1) the Temperature-Acceleration-Pressure probe (TAP), which was limited to temperatures below 85°C and operated only in memory mode; and 2) the High Temperature Tool (HTT), which could only be deployed in standalone mode and was difficult to use. The MTT is a high accuracy and fast responding instrument that resolves inch-scale temperature variations at typical 900 ft/hr logging speeds.

The MTT uses two temperature sensors: a fast responding thermocouple and a highly accurate RTD (Resistance Temperature Detector). It contains two sensor sondes; one is for use at the end of string (typically memory logging), and the other allows the MTT to operate in the middle of a tool string (typically sending data back via Schlumberger telemetry). The MTT can either store log data in flash memory for later recall or send real-time data to the surface via Schlumberger’s telemetry system. To cope with the high ambient temperature, all components except the temperature sensors are contained in a vacuum flask.

The MTT also includes an accelerometer channel to improve data stacking by precisely measuring logging speed and providing better depth corrections. A specialized telemetry system, the Schlumberger-Lamont Telemetry Adapter (SLTA), was developed specifically for the MTT in order to allow the tool to be combined with Schlumberger tools for single logging tool string deployment and to minimize the required rig time necessary to acquire the log.


Applications

Hydrogeology: Temperature excursions can identify sections of inflow or outflow as fluids move through the sediments and the oceanic crust.
Geothermics: Aids in estimating the vertical fluid flow regime and potential geothermal gradients.
Microbiology: Helps determine temperatures ranges and potential fluid flow zones where microbes could thrive.
Gas hydrates: Constrains the depth range of the gas hydrate stability zone.
Safety: Knowledge of borehole fluid temperatures is needed in order to prevent damage to heat sensitive instruments.


Environmental Effects
The MTT response can be affected by borehole size and circulation of fluids during drilling operations. Down flow of colder and denser ocean bottom water after drilling into the borehole can affect the temperature profiles.


Log Presentation
Downhole temperature profile from Hole 1256D showing data collected with the various temperature tools used throughout years of operations in Hole 1256D. The MTT data were collected during IODP Expedition 335 after approximately 5 weeks of drilling operations.

Downhole temperature profile from Hole 1256D showing data collected with the various temperature tools used throughout years of operations in Hole 1256D. The MTT data were collected during IODP Expedition 335 after approximately 5 weeks of drilling operations.


Tool Specifications
Temperature rating: 327°C (621°F) 
Pressure rating: 10 kpsi (69 MPa)
Diameter: 3.5 in (8.9 cm)
Length:
        Inline Sonde: 1.7 ft (0.5 m)
        Bottom Sonde: 0.9 ft (0.3 m)
Weight:
        Inline Sonde: 37 lbs (16.8 kg)
    Bottom Sonde: 27 lbs (12.3 kg)
Number of temperature modules: 2
Module spacing: Variable
Detectors
        RTD: 1/8 in. diameter, 4 wire, Class A
        Thermocouple: 1/32 in. diameter, K thermocouple
        Accelerometer: Surface mounted – ADXL203, U17
Maximum cable length: 30,000 ft (9144 m)
Maximum logging speed: 900 ft/hr (275 m/hr)
Cablehead connection: Schlumberger style
Sample rate
        RTD: 1 Hz
        Thermocouple: 4 Hz
        Accelerometer: 4 Hz


Measurement Specifications 
Range
        Temperature: -273°C to 327°C
        Acceleration:: ±17 m/s2 (±1.7g)
Resolution
        RTD: 0.05°C
        Thermocouple: 0.05°C
        Accelerometer: 0.001 m/s2


Main Outputs
WTEP_LDEO: Temperature (°C)
AZ_LDEO Acceleration (m/s2)


Deployment Notes
The MTT can be run either at the at bottom of the Schlumberger Triple Combo tool string as a memory only tool, or inline between other Schlumberger tools in real-time mode. If used in inline mode, the SLTA needs to be included and pressure bulkheads at the top and bottom of the MTT need to be part of the tool string to isolate Schlumberger tools from potential pressure leaks.

Multi-Sensor Spectral Gamma Ray Tool (MGT)

Multi-Sensor Spectral Gamma Ray Tool (MGT)

Description
mgt_fig1
      The Multi-Sensor Spectral Gamma Ray Tool (MGT) is a third party tool developed by the Lamont-Doherty Borehole Research Group to improve the vertical resolution of natural gamma-ray logs. This is achieved by using an array of short detector modules with approximately 2 ft (60 cm) spacing. Each module comprises a small 2″x4″ (5×100 m) NaI detector, a programmable 256-channel amplitude analyzer, and an Am241 calibration source. The spectral data are later recalculated to determine the concentration of potassium, thorium, and uranium radioisotopes or their equivalents. The spectral data from individual modules are sampled 4 times per second and stacked in real time based on the logging speed. This approach increases vertical resolution by a factor of 3-4 over conventional Schlumberger tools while preserving comparable counting efficiency and spectral resolution. The radius of investigation depends on several factors: hole size, mud density, formation bulk density (denser formations display a slightly lower radioactivity) and the energy of the gamma rays (a higher energy gamma ray can reach the detector from deeper in the formation).
mgt_fig2 The tool also includes an accelerometer channel to improve data stacking by the precise measurement of logging speed. A specialized telemetry system developed for the MGT allows it to be combined with Schlumberger tool strings in a single logging operation, minimizing the required rig time to acquire the log.


Applications

Thin bed analysis: Spectral gamma ray logs provide one of the best means to investigate the mineralogy of thin-bedded sedimentary sequences,  Increasing vertical resolution over currently available tools provides new opportunities for log analysis in reservoirs with rapidly changing lithology and for finer resolution of thin layering and in areas with low sedimentation rates.

Correlation between logging runs

Integration of core and logging data

Paleoclimatology: The added resolution provided by the MGT is particularly useful in paleoclimate studies.


Environmental Effects
The MGT response is affected by borehole size, mud weight, and by the presence of bentonite or KCl in the mud. KCl is sometimes added to the mud to stabilize freshwater clays which tend to swell and form bridges. This procedure takes place before logging operations start, and even though KCl is probably diluted by the time the tool reaches total depth, it can still affect the tool response.


Tool Specifications
Temperature rating: 100°C (212°F)
Pressure rating: 10 kpsi (69 MPa)
Diameter: 3.375 in (8.6 cm)
Length (telemetry module): 9 ft (2.7 m)
Length (measurement module): 9.5 ft (2.9 m)
Weight: 350 lbs (151.1 kg)
Number of spectrometry modules: 4
Module spacing: 25.19 in (64 cm)
Detector  type: NaI(TI)
Detector size: 4×2 in (10×5 cm)
Maximum cable length : 40 ft (131.2 m)
Maximum logging speed : 900 ft/hr (275 m/hr)
Cable head connection: Schlumberger style
Sample rate: 4 sec


Measurement Specifications
Acceleration Range Option 1: ±4 g; Option 2: ±25 g
Pressure Range 0-10 kpsi (69 MPa)
Pressure Resolution 1 psi (6.9 kPa)


Main Outputs 
GR: GAPI
POTA: wt %
THOR: ppm
URAN: ppm


Deployment Notes
The MGT was usually run at the top of the Schlumberger string comprising the HRLA, APS, HLDS, and HNGS tools . The downhole switch in the MGT telemetry module provided switching of the signal and power lines between the MGT and the Schlumberger logging system.

Versatile Seismic Imager (VSI*)

Versatile Seismic Imager (VSI*)

Description
vsiThe Versatile Seismic Imager (VSI) represents the latest available technology in the acquisition of seismic waves generated by a seismic source. The VSI employs three-axis single sensor seismic hardware and software and advanced telemetry for efficient transmission of the data from the borehole to the surface. It consists of three parts (a power cartridge, a control cartridge, and the measurement sonde) and takes its measurements by means of a three-axis gimbaled accelerometer package in the sonde. Each sensor package delivers high-quality wavefields by using three-axis geophone omnitilt accelerometers, which are acoustically isolated from the main body of the tool and provide a flat response from 3 to 200 Hz. The configuration of the tool (number of sensor packages, sensor spacing, and type of connection (stiff or flexible) varies to provide the maximum versatility of the array. A maximum of 20 shuttles can be used.

Regardless of configuration, the tool is used to collect seismic data by anchoring in the hole at the desired depth using a caliper arm. When anchored, the accelerometer package is pressed firmly against the formation while remaining decoupled acoustically from the body of the shuttle. Air guns deployed from the rig by crane then provide the necessary source pulse, and the resulting acoustic wave is recorded downhole on all three axes. The guns are typically held in one location relative to the borehole while the tool is moved to each of the desired depth stations within the hole. The anchoring, size, and acoustic isolation of the sensors allow for suppression of the tool harmonic noise and removal of tube waves from the borehole-seismic band. Furthermore, digitization close to the sensor package helps reduce signal distortion.

Among the benefits of using the VSI tool are the increased operating efficiency (rapid mechanic deployment and reduced time between stations), the short shot-cycle time during remote source surveys, and the real-time quality control and data processing.

The VSI tool can be combined with a gamma ray tool for accurate depth control and an inclinometry tool for spatial orientation. For the sake of avoiding excess noise in the data and damage to the tool due to excessive weight in case of high heave, it is standard practice to run the VSI with only a basic gamma ray sensor and telemetry, normally both provided by the EDTC-B.


Applications
  • Integrated processing for interpretation of borehole and surface seismic data
  • Planning for well placement
  • Simultaneous surface and borehole seismic recording for high definition images
  • Shear wave processing and analysis


Tool Specifications
Temperature rating: 350° F (175° C)
Pressure rating: 20 kpsi (138 MPa)
Diameter: 3.625 in (9.21 cm)
Cartridge length: 20.9 ft (6.37 m)
Cartridge weight: 190.8 lbs (86.5 kg)
Length (multiple shuttles): Up to 1,040 ft (317 m) for 20 shuttles
Shuttle length: 6.4 ft (1.96 m)
Shuttle weight: 70.6 lbs (32 kg)
Sensor length: 11.4 in (29 cm)
Sensor weight: 6.4 lbs (2.9 kg)
Sensor natural frequency: 25 Hz
Flat bandwidth in acceleration:     2-200 Hz
Maximum number of shuttles: 20
Logging speed: Stationary
Sampling rate: Seismic waveform recording: 1, 2, 4 msec
Combinability: Bottom only


*®trademark of Schlumberger

Core Barrel – Extended Memory Drill String Accelerometer (CB-DSA-XM)

Core Barrel – Extended Memory Drill String Accelerometer (CB-DSA-XM)

Description

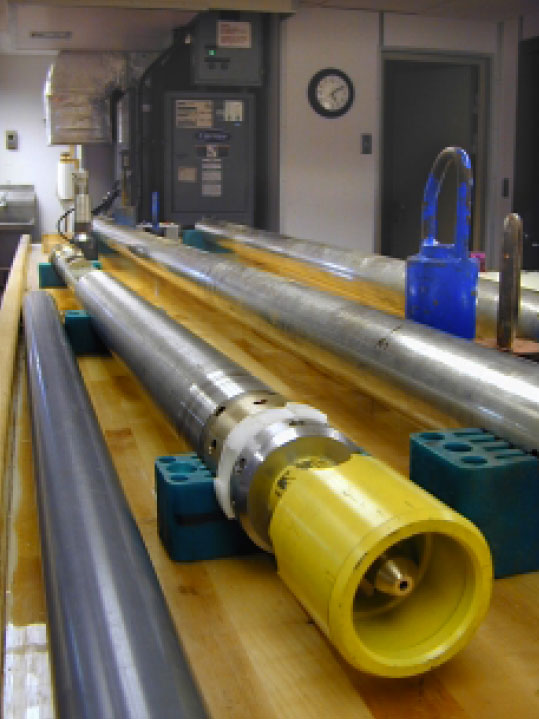
cb_dsa_xmThe Core Barrel- Extended Memory Drill String Accelerometer (CB-DSA-XM) was developed during ODP at USIO Science Services/LDEO as a modification of the CB-DSA, which was used on several ODP legs. The CB-DSA-XM operates as a memory tool that measures and records drill string acceleration and ambient pressures during coring. The tool contains a single-axis (vertical) High Sensitivity Accelerometer (HSA) for heave measurements, a three-axial Low Sensitivity Accelerometer (LSA) for drill bit variations, and a high resolution pressure sensor. The tool can operate in acceleration (LSA and HSA signals recorded at high sampling rate) or pressure (LSA signal and ambient pressure recorded at high sampling rate) mode; in both cases ambient pressure is recorded at low sampling rate (1 sample/sec).

For ease of deployment, the CB-DSA-XM has been designed as a removable extension of the APC/XCB/RCB core barrels.  Using standard threaded connections, the CB-DSA-XM is attached to the top of a selected core barrel prior to core barrel deployment. The tool does not need connection to the logging cable and the data are downloaded to a computer after the tool is retrieved from the hole. During initialization and data downloading procedures, communication with the tool is handled by the CB-DSA-XM LabView program.

The modified tool has a longer data recording time, higher reliability and improved operations capabilities. It allows data recording on consecutive coring trips, and the used of hot-swappable non-volatile memory modules virtually eliminates any delay related to data retrieval procedures. The tool continuously monitors battery voltage and temperature inside the electronics module and preserves recorded data in case of battery failure or at temperatures in excess of the maximum specified for tool operation.


Applications

• Drill string vibration analysis
• Heave evaluation
• Reference signal for Seismic-While-Drilling measurements
• Fluid pressure measurement
• Drilling equipment performance evaluation
• Geotechnical applications (i.e. sediment compaction analysis)


Tool Specifications
Temperature rating: 185° F (85° C)
Pressure rating: 10 kpsi (69 MPa)
Diameter: 3.375 in (8.57 cm)
Length: 7 in (1.2 m)
Weight: 75 lbs (34.1 kg)
Acceleration sampling rate: 100 Hz
Pressure sampling rate: 1 Hz
Frequency bandwidth (HSA Channel): 0-2 Hz
Frequency bandwidth (LSA Channel): 0-50 Hz (at 100 samples/sec); 0-25 Hz (at 50 samples/sec)
Total data recording time: 2.9 hrs (at 100 samples/sec)
Power source: 6 “AA” alkaline batteries
Battery life: about 18 hrs


Measurement Specifications
Acceleration
Range (HSA channel): 2 to +2 g
Range (LSA channel): Option 1: ±4 g; Option 2: ±25 g
Temperature
    Range: 32-185° F (0-85° C)
    Resolution: 0.9° F (0.5° C)
Pressure
Range: 0-10 kpsi (6.9 MPa)
Resolution: 4 psi (27.6 kPa)
Precision: 0.1 % FS


Well Seismic Tool (WST*)

Well Seismic Tool (WST*)

Description
The WST was a Schlumberger single axis check shot tool used for zero offset vertical seismic profiles (VSP). The WST consisted of a single geophone, pressed against the borehole wall, wstthat was used to record the acoustic waves generated by an air gun located near the sea surface. A 120 in³ air gun was suspended by buoys at a depth of 3 meters below sea level, offset 48.5 m from the hole on the portside. The WST was clamped against the borehole wall at intervals of approximately 50 m, and the air gun was fired five to seven times. The resulting waveforms were stacked and a travel time was determined from the median of the first breaks in each trace.

These check shot experiments attempted to reproduce the seismic reflection profiling by simulating a similar geometry and source frequency. In general, the acoustic velocities and resulting depth-travel time pairs determined from the sonic tool differ significantly from the seismic velocities because of frequency dispersion (e.g., the sonic tool works at 10-20 kHz vs. 50-100 Hz in seismic tools) and because the sound is forced to travel along the borehole wall, a path that is quite different from the one taken by the air gun signal generated during a seismic reflection survey. In addition, sonic logs are not obtained above the bottom hole assembly, and the travel time to the uppermost logging point has to be estimated by some other means.
The WST was used during the ODP and IODP from 1986 to 2005.


Applications
Depth-traveltime pairs determined from check shots can be used to produce a depth-travel time plot and to calibrate the sonic logs and determine accurate drilling depths and their relative position with respect to targets on the seismic reflection profiles.


Log Presentation
The first arrival times are plotted against depth (the time vs. depth data derived from core and log sonic velocity measurements can be displayed on the same plot). The interval velocities (gradients of the time vs. depth plot between WST stations) can be plotted in the same track as the sonic velocity log. Velocities are given in m/sec; arrival times are measured in either milliseconds or seconds.
If the WST waveforms have been processed as a zero-offset VSP by the Schlumberger engineer on the ship, the resulting seismogram can be plotted vs. two-way-time alongside the seismic section and the synthetic seismogram.


Tool Specifications
Temperature rating: 350° F (175° C)
Pressure rating: 20 kpsi (138 MPa)
Diameter: 3.625 in (9.21 cm)
Length: 16.9 ft (5.15 m)
Sampling rate: 1, 2 or 4 msec
Maximum Logging speed: Stationary


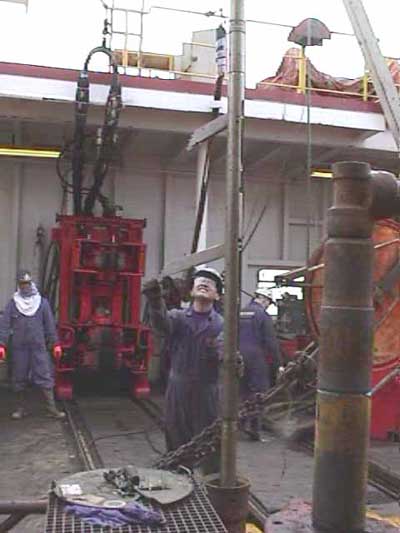
wst_rig_full Deployment Notes
The WST was run alone and placed at stations at regular intervals.
At each station a seismic shot was produced at the sea surface using either air or water guns provided by IODP-USIO Science Services,TAMU. Schlumberger provided a blast hydrophone for synchronizing the gun pulse with the system timer.
The WST and other downhole seismic tools are sensitive to pipe noise and ringing of pipe following a shot. Efforts were made to reduce pipe noise at each station. If time and resources permitted, a drill string packer was deployed to dampen the banging motion of the pipe against the borehole.


*®trademark of Schlumberger

Sonic Digital Tool (SDT*)

Sonic Digital Tool (SDT*)

Description
sonic_toolIn fast formations, where shear velocity is faster than the velocity of the drilling fluid, the SDT obtained direct measurements for shear, compressional, and Stoneley wave values. In a slow formation, the SDT obtained real-time measurements of compressional, Stonily, and mud wave velocities. Shear wave values could then be derived from these velocities. This multireceiver sonic tool, with its linear array of eight receivers, provided more spatial samples of the propagating wavefield for full waveform analysis than the standard two-receiver tools. This arrangement allowed measurements of wave components propagating deeper into the formation past the altered zone.

The depth of investigation cannot be easily quantified; it depended on the spacing of the detectors and on the petrophysical characteristics of the rock, such as rock type, porosity (granular, vacuolar, fracture porosity), and alteration. For source-detector spacings of 3-5 ft, 8-10 ft, and  10-12 ft the depth of investigation ranged from 2 in to 10 in (altered/invaded and undisturbed formation, respectively), 5 in to 25 in, and 5 in to 30 in. The vertical resolution was 2 ft (61 cm).

Until 1999, the SDT was used extensively in combination with the Formation MicroScanner (FMS) during the Ocean Drilling Program. It was run in one of two modes: depth-derived borehole compensated (DDBHC) or linear array. In DDBHC mode, the SDT was capable of operating in both short- and long-spaced modes, and the modes coiuld be run simultaneously when compressional slowness measurements were needed over a wide range of spacings. In linear array mode, the SDT acquired compressional, shear and Stonely waveforms.


Applications
Porosity and “pseudodensity”: The sonic transit time can be used to compute porosity by using the appropriate transform and to estimate fracture porosity in carbonate rocks. In addition,it can be used to compute a “pseudodensity” log over sections where this log has not been recorded or the response was not satisfactory.

Seismic impedance: The product of compressional velocity and density is useful in computing synthetic seismograms for time-depth ties of seismic reflectors.

Sonic waveforms analysis: If a refracted shear arrival is present, its velocity can be computed from the full waveforms, and the frequency content and energy of both compressional and shear arrivals can also be determined.

Fracture porosity: Variations in energy and frequency content are indicative of changes in fracture density, porosity, and in the material filling the pores. In some cases compressional-wave attenuation can also be computed from the full waveforms.


Environmental Effects
One common problem was cycle skipping: a low signal level, such as that occurring in large holes and soft formations, could cause the far detectors to trigger on the second or later arrivals, causing the recorded dt to be too high. This problem could also be related to the presence of fractures or gas.

Transit time stretching appeared when the detection at the further detector occurred later because of a weak signal. Finally, noise peaks were caused by triggering of detectors by mechanically induced noise, which caused DT to be too low.


Log Presentation
DT/DTLN and DTL/DTLF are delay times in microseconds per foot for the near and far receiver pairs, respectively. In very slow formations DTL/DTLF provide the more reliable measurement as the refracted wave is not seen at the near receivers. The acoustic data is usually presented as compressional and, where available, shear velocity in km/s.


Tool Specifications
Temperature rating: 350°F (175°C)
Pressure rating: 20 kpsi (138 MPa)
Diameter: 3.625 in (9.21 cm)
Length:  37.9 ft (11.6 m)
Acoustic bandwidth: 5 kHz to 18 kHz
Waveform duration: 5 ms nominally, 10 ms maximum
Sampling interval: 6 in (15.24 cm)
Maximum logging speed: 1700 ft/hr (518.16 m/hr) for eight receiver array


Main Outputs

Short Spacing Mode
DT: Acoustic slowness, DDBHC Mode (3-5-5-7 ft), Short Spacing (µs/ft)
TT1: DDBHC Short-Spaced Mode, Transit Time 1 (5 ft spacing; µs)
TT2: DDBHC Short-Spaced Mode, Transit Time 2 (3 ft spacing; µs)
TT3: DDBHC Short-Spaced Mode, Transit Time 2 (3 ft spacing; µs)
TT4: DDBHC Short-Spaced Mode, Transit Time 4 (5 ft spacing; µs)
DTL: Acoustic slowness, DDBHC mode (3-5-5-7 ft), Long Spacing (µs/ft)
ITT Integrated Transit Time (sec)

Long Spacing Mode
DTLF: Acoustic slowness, DDBHC Mode (8-10-10-12 ft), Long Spacing Far (µs/ft)
DTLN: Acoustic slowness, DDBHC mode (8-10-10-12 ft), Long Spacing Near (µs/ft)
LTT1: DDBHC Long-Spaced Mode, Transit Time 2 (10 ft spacing; µs)
LTT2: DDBHC Long-Spaced Mode, Transit Time 2 (8 ft spacing; µs)
LTT3: DDBHC Long-Spaced Mode, Transit Time 4 (12 ft spacing; µs)
LTT4: DDBHC Long-Spaced Mode, Transit Time 4 (10 ft spacing; µs)
TT1: DDBHC Short-Spaced Mode, Transit Time 1 (5 ft spacing; µs)
TT2: DDBHC Short-Spaced Mode, Transit Time 2 (3 ft spacing; µs)
TT3: DDBHC Short-Spaced Mode, Transit Time 3 (7 ft spacing; µs)
TT4: DDBHC Short-Spaced Mode, Transit Time 4 (5 ft spacing; µs)
ITT Integrated Transit Time (sec)

Linear Mode
DTCO: Compressional Delay Time (µs/ft)
DTSM: Shear Delay Time (µs/ft)
DTST: Stoneley Delay Time (µs/ft)
ITT: Integrated Transit Time (sec)


*®trademark of Schlumberger

Borehole Televiewer (BHTV)

Borehole Televiewer (BHTV)

Description
The Borehole Televiewer (BHTV) was an acoustic device that scanned the wall of a borehole, producing an image of the reflectivity of the rock surrounding the wellbore as function of depth and azimuth. The BHTV was manufactured by SIMPLEC under license from Mobil Oil Corporation.bhtv
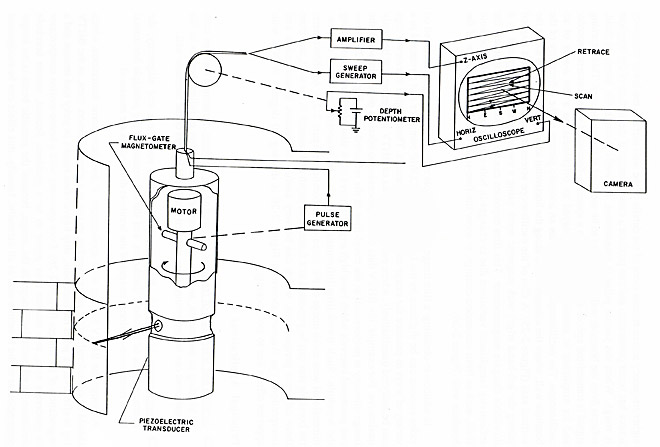
The BHTV log was obtained while logging uphole at a rate of approximately 1.5 meters/minute with the sonde centered in the hole by means of bowspring centralizers. A piezoelectric transducer mounted on a central shaft rotated 3 times per second and transmitted a high-frequency acoustic pulse 600 times per revolution. Two transducers mounted on this shaft allowed the operator to select either a 1.3 MHz or 400 kHz source pulse. While the higher frequency source revealed more of the details of the wall surface, the lower frequency source had better penetration and could produce a cleaner image in borehole with rough walls. When the source pulse was transmitted, it traveled through the borehole fluid, reflected from the borehole wall and returned to be received at the transducer. This returning signal was transmitted uphole and recorded on a specially-formatted video cassette recorder while its amplitude was simultaneously displayed as brightness on a the z-axis of an oscilloscope. The oscilloscope image was thus an acoustic picture of the reflectivity of the borehole wall, where the azimuth and depth varied along the horizontal and vertical axis, respectively. A film of the oscilloscope screen was exposed, which was aligned (along the left-hand edge) with the magnetic north using a sweep generator triggered by a downhole fluxgate magnetometer. This film exposure could be adjusted to compensate for reflectivity (amplitude) variations due to changes in hole size or opacity of the borehole fluid, such as from suspended cuttings, to show the fine-scale detail of the interior of the borehole wall.


Applications

Location and orientation of fractures intersecting the borehole: Structural features such as bedding in sediments, as well as the character and distribution of pillow basalts in the ocean crust, can be determined from oriented amplitude images of the borehole wall.

Measurement of borehole diameter: Wall surface roughness and ellipticity, the characteristics of borehole breakouts, and the orientation of the principal horizontal stress from cross-sectional images of the borehole dimensions are measured.


Log Presentation
In addition to obtaining a film image of the borehole reflectiivity, the signal recorded on video cassette could be digitized by a MASSCOMP computer and processed in a variety of way to enhance the image and improve the results. These digital televiewer logs could be analyzed quantitatively, where previous analyses of BHTV images were at best only qualitative. For example, the BHTV data could be processed to obtain a picture in which the image intensity was proportional to the travel-time of the reflected pulse. Such travel-time information could also be processed to create a three-dimensional wire mesh image of the slope of the borehole. In addition, the borehole size could be presented as a function of depth and azimuth in the well, and from three different prespectives, which could be very useful for fracture identification and interpretation.


Tool Specifications
Temperature rating:  350°F (175°C)
Pressure rating:  20 kpsi (138 MPa)
Diameter: 3.375 in (86 mm)


Natural Gamma Ray Spectrometry Tool (NGT*)

Natural Gamma Ray Spectrometry Tool (NGT*)

Description
ngtThe Natural Gamma Ray Tool (NGT) utilized a sodium-iodide scintillation detector to measure the natural gamma ray radiation of the the three most common components of the naturally occurring radiation: potassium, thorium, and uranium. The high-energy part of the spectrum was divided into three energy windows, each covering a characteristic peak of the three radioactivity series. The concentration of each component was determined from the count rates in each window.

Because the high-energy region contains only 10% of the total spectrum count rates, the measurements were subject to large statistical variations, even using a low logging speed. The results were considerably improved by including the contribution from the low-energy part of the spectrum. Filtering techniques were used to further reduce the statistical noise by comparing and averaging counts at a certain depth with counts sampled just before and after. The final outputs were the total gamma ray, a uranium-free gamma ray measurement, and the concentrations of potassium, thorium, and uranium.

The radius of investigation depended on several factors: hole size, mud density, formation bulk density (denser formations display a slightly lower radioactivity), and on the energy of the gamma rays; (a higher energy gamma ray can reach the detector from deeper in the formation). The vertical resolution on the log was about 1.5 ft (46 cm).spectra

The NGT was deployed during DSDP Leg 95, throughout ODP, and on IODP Expedition 302. It was then replaced by the HNGS.


Applications
Clay typing: Potassium and thorium are the primary radioactive elements present in clays; because the result is sometimes ambiguous, itcan help combining these curves or the ratios of the radioactive elements with the photoelectric effect from the lithodensity tool.

Mineralogy: Carbonates usually display a low gamma signature; an increase in potassium can be related to an algal origin or to the presence of glauconite, while an increase in uranium is often associated with organic matter.

Ash Layer Detection: Thorium is frequently found in ash layers. The ratio of Th/U can also help detect these ash layers.


Environmental Effects
The NGT response was affected by borehole size, mud weight, and by the presence of bentonite or KCl in the mud. In ODP boreholes KCl was sometimes added to the mud to stabilize freshwater clays which tend to swell and form bridges. This procedure took place before logging, and even though KCl was probably diluted by the time the tool reached total depth, it could still affect the tool response. All of these effects were accounted for during the processing of the NGT data onshore.


Log Presentation The NGT log was routinely recorded for correlation between logging runs. To this purpose SGR (total gamma ray in API units) and CGR (computed gamma ray – SGR minus Uranium component – in APIunits) were usually displayed along with other curves (resistivity, sonic, density etc.). A full display of the data with SGR, CGR, and THOR (in ppm), URAN (in ppm), and POTA (in wet wt %) was usually provided separately.
ngtplot

Tool Specifications
Temperature rating: 149°C (300°F)
Pressure rating: 20 kpsi (138 MPa)
Diameter: 3.625 in (9.21 cm)
Length: 8.58 ft (2.61 m)
Sampling interval: 6 in (15.24 cm)
Maximum logging speed 900 ft/hr (275 m/hr)
Depth of investigation 1.5 ft (46 cm)


Measurement Specifications
Vertical resolution:  0.75 to 1 ft (20 to 31 cm)
Depth of investigation 1.5 ft (46 cm)


Main Outputs
SGR Standard (Total) gamma ray (GAPI)
CGR Corrected gamma ray (GAPI)
THOR Thorium (ppm)
URAN Uranium (ppm)
POTA Potassium (dec. fraction)
W1NG Window 1 (0.2 to 0.5 MEV) counts (cps)
W2NG Window 2 (0.2 to 0.5 MEV) counts (cps)
W3NG Window 3 (0.2 to 0.5 MEV) counts (cps)
W4NG Window 4 (0.2 to 0.5 MEV) counts (cps)
W5NG Window 5 (0.2 to 0.5 MEV) counts (cps)


*®trademark of Schlumberger

Phasor Dual Induction-Spherically Focused Resistivity Tool (DIT*)

Phasor Dual Induction-Spherically Focused Resistivity Tool (DIT*)

Description
dit-e In homogeneous formations with resistivity higher than 100 Ω.m the average radial depth of investigation is about 5 ft (1.5 m) and 2.5 ft (76 cm) for the deep and medium induction curves, respectively, and 1.25 ft (38 cm) for the SFL. This drops to 4 ft (122 cm) and 2.2 ft (66 cm) at 0.1 Ω.m resistivities.
The thin bed resolution over a full range of formation conductivities has been greatly improved, due to an enhanced signal processing technique and real time correction for the effect of adjacent formations (shoulder effect).


Applications

Porosity
In sediments that do not contain clay or other conductive minerals, the relationship between resistivity and porosity has been quantified by Archie’s Law. Archie’s Law relates the resistivity to the inverse power of porosity. This relationship has also been used to estimate apparent porosity in oceanic basalts.

Density and velocity
Archie’s equation has been used effectively to create “pseudo-density” and/or “pseudo-velocity” logs from porosity over intervals where no such logs were recorded or were totally unreliable. In some instances velocities derived from resistivity logs can be used to depth-tie seismic reflectors.

Lithologic boundaries and textural changes
Resistivity, along with acoustic and velocity logs, is a very valuable tool in defining lithologic boundaries over intervals of poor core recovery. In a particular example, the decrease in resistivity toward the top of a carbonate unit, coupled with a decrease in velocity, allowed one to interpret this unit as a fining-upward sequence in mostly carbonatic sediments. Similar saw-tooth patterns in the resistivity response can also be observed in oceanic basalt units where they are related to porosity changes towards the top of each unit.


Environmental Effects
The Phasor Dual Induction tool provides a set of corrections for different environmental effects, which can be performed in real time during logging. These include corrections for adjacent formations, borehole signal, and invasion. In general, invasion is not a problem in the boreholes logged in the Integrated Ocean Drilling Program, because seawater is used as drilling fluid, but it can occur in land wells. In fact, depending on the type of drilling mud used and on the permeability of the formation, invasion of the mud filtrate into the formation adjacent to the borehole can lead to differences in the response of shallow and deeper resistivity devices. On the other hand, invasion can provide useful information about formation permeability and pore fluid electrical conductivity. Differences in the temperature of drilling fluid compared to undisturbed formation temperatures can also generate this effect, as conductivity in ionic fluids such as seawater is strongly temperature dependent.


Log Presentation
Deep (ILD or IDPH) and medium (ILM or IMPH) induction, and spherically focused resistivity (SFLU), are usually plotted in Ω.m on a logarithmic scale along with gamma ray and caliper logs. ditplot
Tool Specifications
Temperature rating: 350° F (175° C)
Pressure rating: 20 kpsi (138 MPa)
Diameter: 3.375 in (9.21 cm)
Length: 31 ft (9.5 m)
Weight: 445 lbs (201.9 kg)
Sampling interval: 6 in (15.24 cm)
Max. logging speed: 0,000 ft/hr (3,048 m/hr)


Measurement Specifications 
Vertical resolution: 5-6 ft (1.5-1.8 m), medium induction
7-8 ft (2.1-2.4 m), deep induction
3 ft (92 cm),  spherically focused
Depth of investigation: (See discussion in “Description” section)
Measurement range: 0-150 Ω.m


Main Outputs
ILD: Deep induction (Ω.m)
ILM: Medium induction (Ω.m)
IDPH: Phasor deep induction (Ω.m)
IMPH: Medium deep induction (Ω.m)
SFLU: Spherically focused log (Ω.m)


Deployment Notes
Typically run with the APS, HLDS, and HNGS, the DIT can be replaced by the DLL or the HRLA. The DIT has an internal temperature measurement which may be useful in high temperature environments.


*®trademark of Schlumberger

SlimXtreme Array Induction Imager Tool (QAIT*)

SlimXtreme Array Induction Imager Tool (QAIT*)

Description
The Array Induction Imager tool accurately measures the borehole formation conductivity in open holes as a function of both depth and distance from the borehole; the SlimXtreme version (QAIT) was designed to work in slim holes under severe environmental conditions. Wireline array induction tools employ an array induction coil that operates at multiple frequencies. Software focusing of the received signals generates a series of resistivity logs with different depth of investigation.  Thanks to the large number of measurements performed, it is possible to obtain quantitative two-dimensional  (2D) imaging of the formation resistivity.

Measurement of the conductivity as a function of both depth and distance from the borehole greatly improves induction logging by increasing the depth of investigation of the measured signal as well as bringing the vertical resolution from 4 to 2 ft (1 ft in smooth boreholes).


Tool Specifications
Temperature rating: 500°F (260°C)
Pressure rating: 30 kpsi (207  MPa)
Diameter: 3 in (7.62 cm)
Length: 30.8 ft (9.39 m)
Weight: 499 lbs (226 kg)
Sampling interval: 6 in (15.15 cm)
Maximum logging speed: 3,600 ft/hr (1,097 m/hr)


Measurement Specifications
Measurement range: 0.1-2,000 Ω.m
Accuracy: Approximately 2%
Vertical resolution: 1,2 and 4 ft (30, 60 and 120 cm)
Depth of investigation: 10,20,30,60, 90 in (25.4, 50.8, 76.2, 152.4, 228.6 cm)  


Deployment Notes
The QAIT can be deployed with any tool string.


*®trademark of Schlumberger